One-way MANOVA in SPSS Statistics
Introduction
The one-way multivariate analysis of variance (one-way MANOVA) is used to determine whether there are any differences between independent groups on more than one continuous dependent variable. In this regard, it differs from a one-way ANOVA, which only measures one dependent variable.
For example, you could use a one-way MANOVA to understand whether there were differences in the perceptions of attractiveness and intelligence of drug users in movies (i.e., the two dependent variables are "perceptions of attractiveness" and "perceptions of intelligence", whilst the independent variable is "drug users in movies", which has three independent groups: "non-user", "experimenter" and "regular user"). Alternatively, you could use a one-way MANOVA to understand whether there were differences in students' short-term and long-term recall of facts based on three different lengths of lecture (i.e., the two dependent variables are "short-term memory recall" and "long-term memory recall", whilst the independent variable is "lecture duration", which has four independent groups: "30 minutes", "60 minutes", "90 minutes" and "120 minutes").
Note: If you have two independent variables rather than one, you can run a two-way MANOVA instead. Alternatively, if you have one independent variable and a continuous covariate, you can run a one-way MANCOVA. In addition, if your independent variable consists of repeated measures, you can use the one-way repeated measures MANOVA.
It is important to realize that the one-way MANOVA is an omnibus test statistic and cannot tell you which specific groups were significantly different from each other; it only tells you that at least two groups were different. Since you may have three, four, five or more groups in your study design, determining which of these groups differ from each other is important. You can do this using a post-hoc test (N.B., we discuss post-hoc tests later in this guide).
In this "quick start" guide, we show you how to carry out a one-way MANOVA using SPSS Statistics, as well as interpret and report the results from this test. Since the one-way MANOVA is often followed up with post-hoc tests, we also show you how to carry these out using SPSS Statistics. However, before we introduce you to this procedure, you need to understand the different assumptions that your data must meet in order for a one-way MANOVA to give you a valid result. We discuss these assumptions next.
SPSS Statistics
Basic requirements and assumptions of a one-way MANOVA
When you choose to analyse your data using a one-way MANOVA, part of the process involves checking to make sure that the data you want to analyse can actually be analysed using a one-way MANOVA. You need to do this because it is only appropriate to use a one-way MANOVA if your data "passes" nine assumptions that are required for a one-way MANOVA to give you a valid result. Do not be surprised if, when analysing your own data using SPSS Statistics, one or more of these assumptions is violated (i.e., is not met). This is not uncommon when working with real-world data. However, even when your data fails certain assumptions, there is often a solution to overcome this.
In practice, checking for these nine assumptions adds some more time to your analysis, requiring you to work through additional procedures in SPSS Statistics when performing your analysis, as well as thinking a little bit more about your data. These nine assumptions are presented below:
- Assumption #1: Your two or more dependent variables should be measured at the interval or ratio level (i.e., they are continuous). Examples of variables that meet this criterion include revision time (measured in hours), intelligence (measured using IQ score), exam performance (measured from 0 to 100), weight (measured in kg), and so forth. You can learn more about interval and ratio variables in our article: Types of Variable.
- Assumption #2: Your independent variable should consist of two or more categorical, independent groups. Example independent variables that meet this criterion include ethnicity (e.g., 3 groups: Caucasian, African American and Hispanic), physical activity level (e.g., 4 groups: sedentary, low, moderate and high), profession (e.g., 5 groups: surgeon, doctor, nurse, dentist, therapist), and so forth.
- Assumption #3: You should have independence of observations, which means that there is no relationship between the observations in each group or between the groups themselves. For example, there must be different participants in each group with no participant being in more than one group. This is more of a study design issue than something you can test for, but it is an important assumption of the one-way MANOVA.
- Assumption #4: You should have an adequate sample size. Although the larger your sample size, the better; for MANOVA, you need to have more cases in each group than the number of dependent variables you are analysing.
- Assumption #5: There are no univariate or multivariate outliers. First, there can be no (univariate) outliers in each group of the independent variable for any of the dependent variables. This is a similar assumption to the one-way ANOVA, but for each dependent variable that you have in your MANOVA analysis. Univariate outliers are often just called outliers and are the same type of outliers you will have come across if you have conducted t-tests or ANOVAs. We refer to them as univariate in this guide to distinguish them from multivariate outliers. Multivariate outliers are cases which have an unusual combination of scores on the dependent variables. In our enhanced one-way MANOVA guide, we show you how to: (1) detect univariate outliers using boxplots, which you can do using SPSS Statistics, and discuss some of the options you have in order to deal with outliers; and (2) check for multivariate outliers using a measure called Mahalanobis distance, which you can also do using SPSS Statistics, and discuss what you should do if you have any.
- Assumption #6: There is multivariate normality. Unfortunately, multivariate normality is a particularly tricky assumption to test for and cannot be directly tested in SPSS Statistics. Instead, normality of each of the dependent variables for each of the groups of the independent variable is often used in its place as a best 'guess' as to whether there is multivariate normality. You can test for this using the Shapiro-Wilk test of normality, which is easily tested for using SPSS Statistics. In addition to showing you how to do this in our enhanced one-way MANOVA guide, we also explain what you can do if your data fails this assumption.
- Assumption #7: There is a linear relationship between each pair of dependent variables for each group of the independent variable. If the variables are not linearly related, the power of the test is reduced. You can test for this assumption by plotting a scatterplot matrix for each group of the independent variable. In order to do this, you will need to split your data file in SPSS Statistics before generating the scatterplot matrices.
- Assumption #8: There is homogeneity of variance-covariance matrices. You can test this assumption in SPSS Statistics using Box's M test of equality of covariance. If your data fails this assumption, you may also need to use SPSS Statistics to carry out Levene's test of homogeneity of variance to determine where the problem may lie. We show you how to carry out these tests using SPSS Statistics in our enhanced one-way MANOVA guide, as well as discuss how to deal with situations where your data fails this assumption.
- Assumption #9: There is no multicollinearity. Ideally, you want your dependent variables to be moderately correlated with each other. If the correlations are low, you might be better off running separate one-way ANOVAs, and if the correlation(s) are too high (greater than 0.9), you could have multicollinearity. This is problematic for MANOVA and needs to be screened out. Whilst there are many different methods to test for this assumption, in our enhanced one-way MANOVA guide, we take you through one of the most straightforward methods using SPSS Statistics, and explain what you can do if your data fails this assumption.
You can check assumptions #5, #6, #7, #8 and #9 using SPSS Statistics. Before doing this, you should make sure that your data meets assumptions #1, #2, #3 and #4, although you don't need SPSS Statistics to do this. Just remember that if you do not run the statistical tests on these assumptions correctly, the results you get when running a one-way MANOVA might not be valid. This is why we dedicate a number of sections of our enhanced one-way MANOVA guide to help you get this right. You can find out about our enhanced content as a whole on our Features: Overview page, or more specifically, learn how we help with testing assumptions on our Features: Assumptions page.
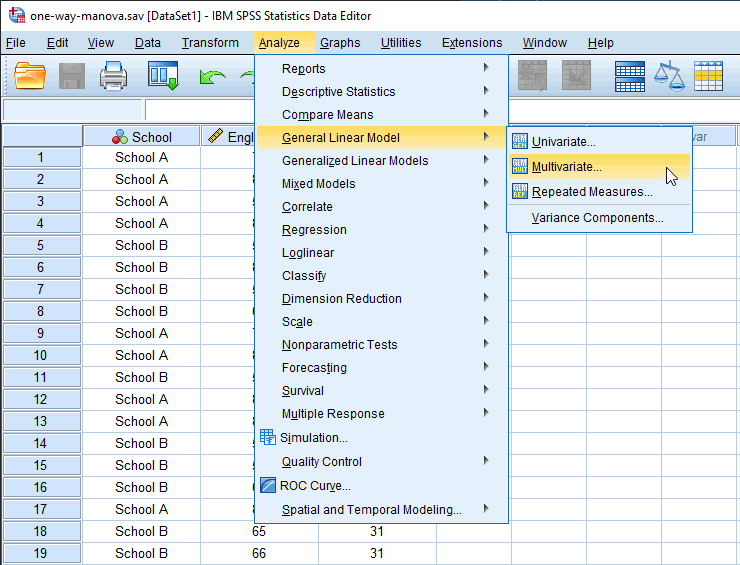
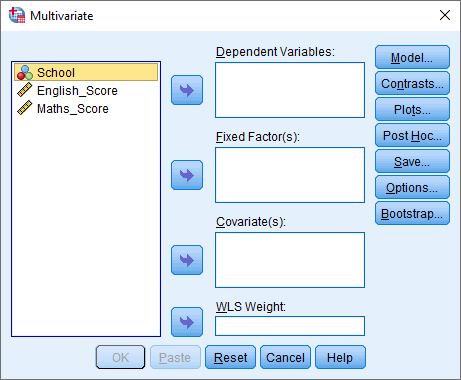
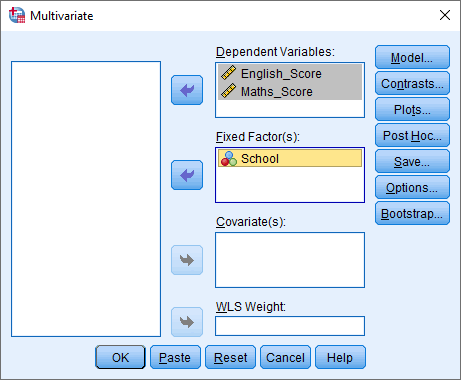
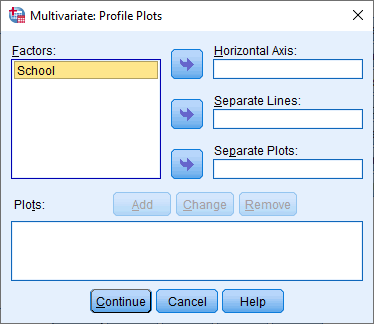
In the section, Procedure, we illustrate the SPSS Statistics procedure to perform a one-way MANOVA assuming that no assumptions have been violated. First, we set out the example we use to explain the one-way MANOVA procedure in SPSS Statistics.