SPSS Statistics sets out its data in a spreadsheet-like manner. The principle behind entering data in almost all cases in SPSS Statistics is to enter each unique case on a new row. A case is the "object" which you are measuring in someway. Usually, a case is an individual, but it can also be a commercial product or a biological cell (or something else entirely). For the purposes of this explanation, we shall assume that a case is an individual. Therefore, when entering data into SPSS Statistics you must put one person's data on one row only. If you find that you have an individual's data on more than one row then you have made a mistake. Equally, if a row contains more than one person's data, you have also made a mistake.
We shall now look at the three most common tasks you face when entering data into SPSS Statistics, plus three more advanced setups:
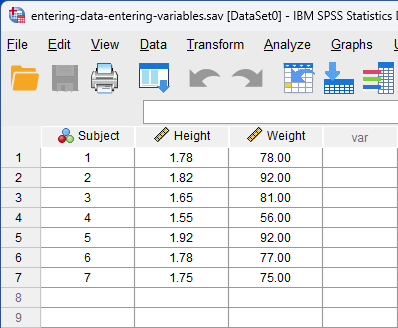
If you do not have repeated measures, SPSS Statistics treats each column as a separate variable. Thus, each variable goes in a separate column. For example, if we had measured the height and weight of a group of individuals, the data in SPSS Statistics would look like the following:
Published with written permission from SPSS Statistics, IBM Corporation.
The Subject column has been added so that it is clear that each individual is placed on a separate row. However, SPSS Statistics does not need you to enter this column, and it is mostly for you to be able to better visualize your data. So, even if we ignored the Subject column, we can see that one individual was 1.55 m tall and weighed 56 kg, looking at the Height and Weight columns, respectively. How to label variable columns is in our Working with Variables guide. To add more variables, simply add more columns - one column per variable. The only variation to this is discussed later in this guide when we have to enter repeated measures.
SPSS Statistics
Defining Separate Groups
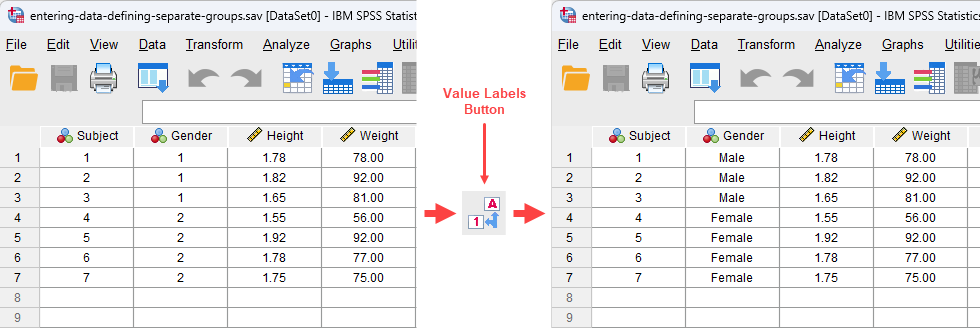
Separate groups are more commonly called between-subjects factors or independent groups. They are groups where the individuals in each group are unique (i.e., no person is in more than one group). In this sense, you could call the groups "mutually-exclusive". A common example is when differentiating between gender. You want to label some of your individuals as female and others as male. To identify which subjects were males and which were females, you need to create a "grouping variable" in SPSS Statistics. This is a separate column that includes information on which group a subject belongs to. We do this by labelling our groups numerically. For example, we label "males" as "1" and "females" as "2". By using the value attribute we can label these numbers as representing males and females, respectively. An example is shown below:
Published with written permission from SPSS Statistics, IBM Corporation.
Looking at the columns on the left we can see that we have created a "grouping variable" called "Gender" that has two categories: "1" and "2". Because we labelled the numbers using the value attribute we can use the Value Label Button to switch to the text version of the "grouping variable" categories. In this example, we can see that "1" and "2" are replaced by "Male" and "Female", respectively. How to do this is explained in our guide on Working with Variables. You do not need to add text labels – SPSS Statistics will work fine without them – but it can provide extra clarity when analysing your data (especially as text labels are often used in the output instead of the numbers – this helps greatly). We can see in this example that the first three subjects were males and the last four subjects were females. What if you have more than two categories of your "grouping variable"? Simple, just add more numbers with, we recommend, corresponding text labels.
Join the 10,000s of students, academics and professionals who rely on Laerd Statistics.TAKE THE TOURPLANS & PRICING
SPSS Statistics
Entering Repeated Measures
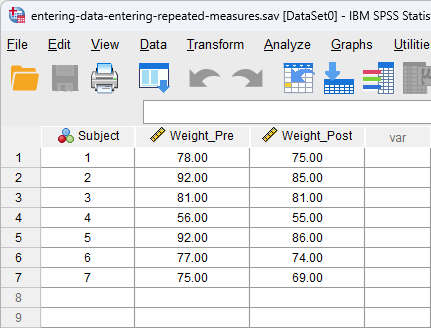
Repeated measures, also called within-subject factors or related groups, are variables that are measured on more than one occasion. This can occur when you have measured the same subject for the same variable at more than one time point or under more than one condition. For example, you measured body weight at the beginning and end of a weight-loss programme. To enter this into SPSS Statistics, you must ignore the "one-variable-one-column" rule and put each time point or condition in a new column as follows:
Published with written permission from SPSS Statistics, IBM Corporation.
Here, we have labelled their weight at the beginning of the weight-loss programme as "Weight_Pre" and their weight after the weight-loss programme as "Weight_Post". It does not matter what you call these "related" columns (you could have called them weight1 and weight2, for example), as long the columns make sense to you. If you have a lot of time points and/or conditions, labelling the variables logically is important because otherwise it can become very confusing determining which variable is which. This is important as SPSS Statistics cannot tell the difference between columns that contain different variables and columns that contain a repeated variable. Therefore, it cannot help you.
SPSS Statistics
Multiple Separating Groups
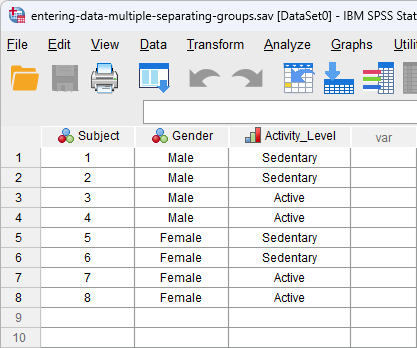
Sometimes, such as when running a two-way ANOVA or when entering in your whole study data, you need to separate your subjects twice (i.e., on two separate variables). For example, you need to separate subjects by their gender (male/female) and their physical activity level (sedentary/active). This will require two columns that act as "grouping variables", as shown below:
Published with written permission from SPSS Statistics, IBM Corporation.
Here, we can see that, for example, Subject 1 was male and sedentary, and Subject 7 was female and active. Notice that we are using the text labels as described earlier in this guide for added clarity.
Join the 10,000s of students, academics and professionals who rely on Laerd Statistics.TAKE THE TOURPLANS & PRICING
SPSS Statistics
Mixing Separate Groups and Repeated Measures
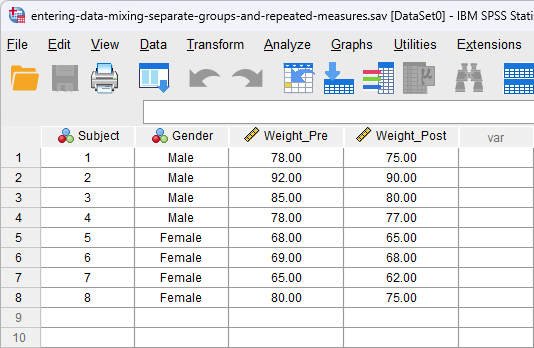
Sometimes, we have separated subjects into groups and then measured them repeatedly on the same dependent variable. Such data might be analysed using a mixed ANOVA. If we had males and females undertake a weight-loss programme and we weighted them pre- and post-intervention, we would have the following setup in SPSS Statistics:
Published with written permission from SPSS Statistics, IBM Corporation.
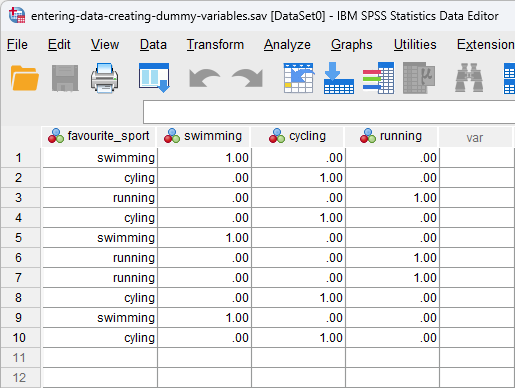
If you are analysing your data using multiple regression and any of your independent variables were measured on a nominal or ordinal scale, you need to know how to create dummy variables and interpret their results. This is because nominal and ordinal independent variables, more broadly known as categorical independent variables, cannot be directly entered into a multiple regression analysis. Instead, they need to be converted into dummy variables. The exception is ordinal independent variables that are entered into a multiple regression as continuous independent variables, which do not need to be converted into dummy variables. An example of three dummy variables – "swimming", "cycling" and "running" – are illustrated in the Data View below for the nominal independent variable, "favourite_sport".
Published with written permission from SPSS Statistics, IBM Corporation.
In our guide, Creating dummy variables in SPSS Statistics, we show how to use the Create Dummy Variables procedure create dummy variables in SPSS Statistics, as well as explaining the basic principles of dummy variables and dummy coding.