Everything you need to complete your data analysis.
If you're analysing data as part of your dissertation, thesis or research project, or as part of a statistics course, Laerd Statistics was designed for you. Our comprehensive, step-by-step guides help you to (1) select the correct statistical tests to analyse your data with, (2) carry out those statistical test using IBM SPSS Statistics, and (3) understand and write up your results. To make this process easier, we use plain English, and assume you have little or no knowledge of statistics or SPSS Statistics. Learn more about Selecting Tests or Everything SPSS Statistics, or read what some of our users say below:

Thank you VERY much for putting this site together! I have found it to be invaluable in my dissertation statistics and can't believe how much I've come to rely on so quickly.Allen, USA
I just signed up for Laerd Statistics and must say that your website is just what I needed! Your guides are very detailed and easy to follow, which is just perfect!Anne, Denmark
I want to congratulate the staff for providing such a clear and precise educational site. I am a PhD student and just completed three back to back graduate statistic courses. The information was invaluable and the SPSS guides were so much easier to follow than any other book or website.Katherine, USA
Selecting Tests
Make sure you're using the correct statistical tests to analyse your data.
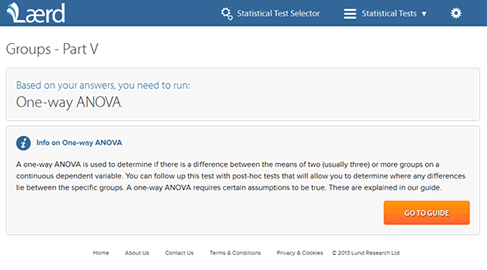
The first stage in any data analysis is to identify the correct statistical tests to analyse your data with. What statistical tests are most appropriate will depend on your study design, the hypotheses or research questions you are trying to answer, as well as the types of variables you have used. Our Statistical Test Selector guides you through the process of selecting the correct test to analyse your data, assuming you have little or no knowledge of study designs or statistics.
LEARN MORE
Everything SPSS Statistics
Use Laerd Statistics as your definitive SPSS Statistics guide.
Laerd Statistics shows you how to analyse your data using the popular statistics package, IBM SPSS Statistics. Our guides provide step-by-step instructions, assuming you have little or no knowledge of SPSS Statistics. For each statistical test, we take you through the complete data analysis process. This starts with entering data into SPSS Statistics, through to testing the assumptions that are required when using different statistical test, and finally, showing you how to analyse, interpret and write up your data. With a wide range of statistical tests covered, use Laerd Statistics as your definitive SPSS Statistics guide.
Working with data
Before carrying out analysis in SPSS Statistics, you need to set up your data file correctly. This can be a simple process, but the setup you need to use will vary based on the type of data you have, as well as the statistical test you are using to analyse your data. If your data is not as simple as you first thought, you may have to apply filters, split files, reverse code variables, and even weight cases. In our step-by-step guides, we explain what these things are and when you might use them, as well as showing you how to do carry them out using SPSS Statistics.
LEARN MORETesting Assumptions
Every statistical test has what are known as "assumptions" that must be met if the test can be used. Therefore, part of the data process involves checking to make sure that your data doesn't fail these assumptions. Unfortunately, a lot of data fails at least one assumption. Our guides show you how to check for assumptions using SPSS Statistics, as well as presenting possible solutions when your data fails to meet such assumptions.
LEARN MOREAnalysing data using SPSS
After entering your data into SPSS Statistics correctly, and testing the assumptions required to analyse your data using specific statistical tests, you'll need to use SPSS Statistics to analyse your data. Our comprehensive, step-by-step guides show you how to carry out a wide range of statistical tests using SPSS Statistics. We assume you have little or no knowledge of statistics and SPSS Statistics, so provide explanations and tips to help you along the way.
LEARN MOREWriting up
To write up your data analysis correctly, you need to be able to accurately interpret the tables and graphs that SPSS Statistics produces. While SPSS Statistics produces many tables, in particular, you often only need to interpret and report a small proportion of these. How you interpret this SPSS Statistics "output" will depend on the results from your assumptions tests, as well as the statistical tests you carried out. We show you which parts of this SPSS Statistics output you need to interpret and how to write up your results.
LEARN MORE