Test that your data meets important assumptions.
Every statistical test has what are known as "assumptions" that must be met if the test can be used. Therefore, part of the data process involves checking to make sure that your data doesn't fail these assumptions. When analysing your data using SPSS Statistics, don't be surprised if it fails at least one of these assumptions. This is not uncommon when working with real-world data rather than textbook examples, which often only show you how to carry out statistical tests when everything goes well! However, don't worry. Even when your data fails certain assumptions, there is often a solution. Our guides: (1) help you to understand the assumptions that must be met for each statistical test; (2) show you ways to check whether these assumptions have been met using SPSS Statistics (where possible); and (3) present possible solutions if your data fails to meet the required assumptions.

I have found your site amazingly helpful for third year psychology! Thank you!!!Annabel, Australia
I love the tutorials that you provide. They are comprehensive and helpful beyond belief.Denise, USA
Really, it is very amazing! ...I feel very happy to find such a good site for learning statistics.Riaz, Pakistan
Understand the required assumptions
First, we tell tell you what assumptions are required for a particular statistical test (e.g., types of variables required, the impact of outliers, the need for independent of observations, normality, homogeneity of variances, or sphericity, etc.). Some statistical tests have more requirements than others. Next, in simple, straightforward language, we explain what the assumptions mean in the context of the statistical tests you are interested in. Finally, we tell you how to determine whether your data meets these assumptions. Where relevant, we also explain the order in which each assumption should be tested.
Check whether the assumptions are met
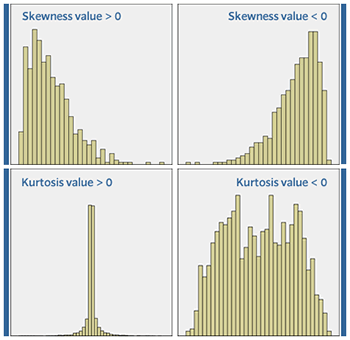
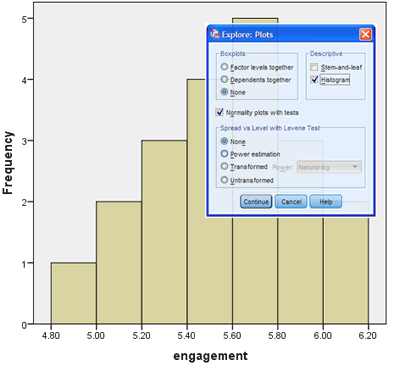
First, we provide comprehensive, step-by-step instructions to show you how to test for each assumption using SPSS Statistics (e.g., procedures such as creating boxplots, scatterplots, Normal Q-Q Plots or P-P plots; how to use casewise diagnostics; how to perform tests such as the Shapiro-Wilk test of normality, Levene's test for homogeneity of variances, and Mauchly's test of sphericity, etc.). Finally, we explain how to interpret the results from these procedures so that you can determine whether your data has met the required assumptions. Where it is not obvious how to interpret these results (i.e., there are no "yes/no" answers), we provide some guidance.
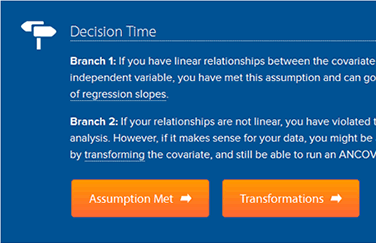
Find solutions if assumptions are not met
If your data fails any of the required assumptions (this is typical), we present a wide range of solutions. For example, you may be able to ignore "outliers" if you can justify their inclusion. You may be able to "transform data" when it is not "normal". You may be able to run the statistical test anyway because it is quite robust to violating certain assumptions. There may be alternative statistical tests that you can run that don't require the same assumptions to be met. We explain what these solutions are, what procedures you can use in SPSS Statistics to deal with certain violations of these assumptions, and how to explain violations when carrying out your analysis if there are no obvious solutions.