Learn how to use SPSS Statistics to analyse your data.
Our comprehensive, step-by-step guides show you how to analyse your data using a wide range of statistical tests, from the very basic to the much more advanced. For each statistical test, we take you through the complete procedure that you will use in SPSS Statistics, assuming you have little or no knowledge of SPSS Statistics or statistics. All guides include large screenshots and step-by-step instructions, as well as tips and notes that will help you to understand what is happening to your data along the way. With a wide range of statistical tests covered, use Laerd Statistics as your definitive SPSS Statistics guide. See what our users' say below, or learn more about our Step-by-Step Guides, Examples, Options, Advanced Tips and Guides, and the Statistical Tests that we currently cover.

I love your simple step-by-step explanation of SPSS.Paul, USA
Your SPSS tutorials are absolutely fantastic. Really helped me get to grips with SPSS and explain things in a very easily understood manner. Keep up the good work!Jamal, UK
Your guides are very good; better than any textbook I have read.Meysam, Canada
Step-by-Step Guides
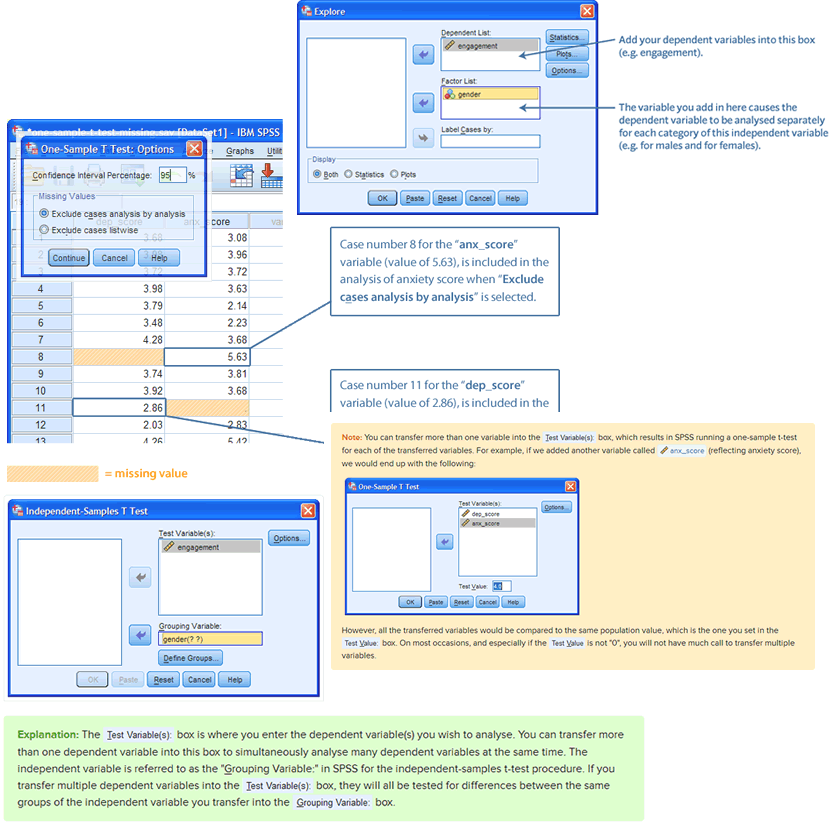
Each of our guides shows you how to carry out a different statistical test using SPSS Statistics. We start by explaining what the test is, when you should use it, and what you will be able to conclude from it. We then guide you through the SPSS Statistics procedure with comprehensive, step-by-step instructions with large SPSS Statistics screenshots. Along the way, we include important notes and explanation so that you don't simply know what buttons to click and options to select within SPSS Statistics, but also how the specifics of your data may influence what choices you should make. Again, all guides have been written assuming that you have little or no knowledge of SPSS Statistics or statistics.
Examples
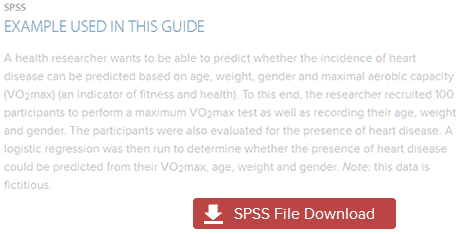
When we show you how to use SPSS Statistics to carry out a particular statistical test, we do this using an example. If you want to practice before analysing your own data, you can download the SPSS Statistics data file for each example. You'll quickly be able to check that you get the same results that we do.
Options
Since there can be different numerical and graphical ways to approach the analysis of your data in SPSS Statistics, we show you what these are, and when/why you should use these different options. In addition, SPSS Statistics now has many new methods of presenting data using its Model Viewer. We explain how to use this new type of procedure and output, and what the advantages are.
Advanced Tips and Guides
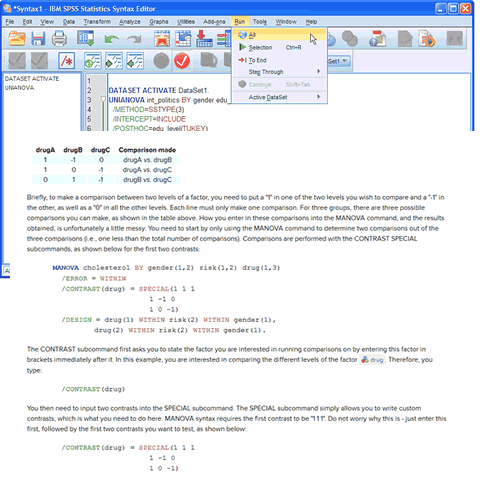
If you are a doctoral student or researcher, you may be required to have a more advanced understand of the statistical methods underpinning SPSS Statistics (e.g., how SPSS Statistics calculates confidence intervals when using different commands for the same statistical test). We help you to understand some of these features and their implications, using straightforward language, without the need for a deep understanding of mathematics. In addition, you may need to run more advanced statistical tests (e.g., mixed ANOVA, principal components analysis, logistic regression, etc.), including statistical tests where you have to insert syntax into SPSS Statistics rather than simply using the normal dialogue boxes (e.g., factorial ANOVA and within-within-subjects ANOVA). In such cases, we include the syntax in our guides and show you where and what you need to insert to make the process easier. With a growing list of advanced SPSS Statistics guides, use our guides to feel confident that you are carrying out the correct data analysis.
Statistical Tests
We have a wide range of SPSS Statistics guides to help you analyse your data. These are:
Differences between groups
- Independent-samples t-test
- Paired-samples t-test
- One-way ANOVA
- Repeated measures ANOVA
- Two-way ANOVA
- Factorial (three-way) ANOVA
- Within-within-subjects ANOVA
- Three-way repeated measures ANOVA
- Three-way mixed ANOVA
- Mixed ANOVA
- Hotelling's T2
- One-way MANOVA
- Two-way MANOVA
- One-way MANCOVA
- One-way ANCOVA
- Two-way ANCOVA
- Mann-Whitney U test
- Wilcoxon signed-rank test
- Kruskal-Wallis H test
- Jonckheere-Terpstra test
- Friedman test
- McNemar's test
- Cochran's Q test
- Sign test
- Test of two proportions
- Chi-square test of homogeneity (2 x C)
- Chi-square test of homogeneity (R x 2)
One sample
- One-sample t-test
- Chi-square goodness-of-fit
Survival analysis
- Kaplan-Meier
Reliability
- Cronbach's Alpha
- Cohen's kappa
- Fleiss' kappa
- Weighted kappa
- Kendall's W
Predicting scores
- Linear regression
- Multiple regression
- Hierarchical multiple regression
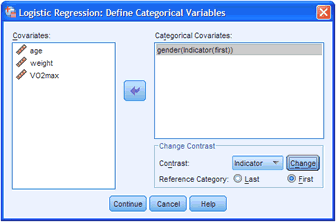
- Logistic regression
- Ordinal regression
Associations
- Pearson's correlation
- Point-biserial correlation
- Pearson's partial correlation
- Spearman's correlation
- Kendall's τb (tau-b)
- Goodman and Kruskal's γ (gamma)
- Somers' d
- Mantel-Haenszel test of trend
- Cochran-Armitage test of trend
- Chi-square test for association (2x2)
- Chi-square test of independence (RxC)
- Fisher's exact test (2x2) for independence
- Relative risk (2 x 2)
- Odds ratio (2 x 2)
- Goodman and Kruskal's λ (lambda)
- Loglinear analysis
Data reduction
- Principal components analysis
Assumptions
- Testing for normality
- Transforming data
Moderation
- Dichotomous moderator analysis
Graphs and charts
- Bar chart
- Clustered bar chart
- Simple error bar chart
- Simple 3-D bar chart
- Simple line graph
- Multiple line graph
- Simple area chart
- Stacked area chart
- Simple scatterplot
- Grouped scatterplot
- Scatterplot matrix
- Simple dot plot
- Simple 3-D scatterplot
- Simple histogram
- Stacked histogram
- Frequency polygon
- Boxplot
- Clustered boxplot
- 1-D boxplot
- Pie chart
- Population pyramid
Getting to know SPSS
- Creating a new file
- Opening a file
- Data setup in SPSS
- Reverse coding in SPSS
- Selecting cases in SPSS
- Splitting a file
- Weighting cases
- Mean centring continuous variables
- Creating dummy variables
- Calculating a total score
- Calculating a mean score
- Creating an ID variable
- Recoding a continuous to an ordinal variable
- Recoding a continuous to a dichotomous variable
- Calculating a z-score (standard score)
We are adding guides all the time, and have a schedule of new SPSS Statistics guides that we will be adding in November 2026 and beyond. We also maintain a "wishlist" from our users, which forms the basis of our schedule. Therefore, if there is a particular guide you want that you don't see below, please contact us. We can let you know when we will be able to add a suitable guide to the site.
- Cox regression,
- multinomial logistic regression,
- one-way repeated measures MANOVA,
- intraclass correlation coefficient (ICC),
- Poisson regression,
- negative binomial regression,
- and introductions to linear mixed models (LMM)
- and generalised estimating equations (GEE)