Make your analysis easier by setting up your data properly.
Before carrying out analysis in SPSS Statistics, you need to set up your data file correctly. If you have a simple data set (e.g., you have no missing values or outliers), or you are performing some of the more straightforward statistical tests, you may only need to know the basics of data setup (see Data Setup and Entry). However, data sets that come from the real-world, rather than textbook examples, are rarely so simple. You may have to Select and Filter Data, Split Files, Reverse Code Variables and Weight Cases. We make these things, and more, easy with our step-by-step guides.

I am very grateful to have found this website. It has been very helpful to understand what I am doing with my data for this research I'm doing.Dr Pham, Netherlands
Good site, you have my cash and a bunch of my labmates have joined as well.Ian, Australia
I want to congratulate the staff for providing such a clear and precise educational site. I am a PhD student and just completed three back to back graduate statistic courses. The information was invaluable and the SPSS guides were so much easier to follow than any other book or website.Katherine, USA
Data Setup and Entry
To setup your data so that it can be properly analysed, you need to understand the Variable View and Data View in SPSS Statistics. The Data View is very simple, but relies on you correctly setting up the Variable View, which is where you label your variables and tell SPSS Statistics how they were measured. Rather than just providing you with a general guide to setting up your data, we show you how to do this for every statistical test in our site (i.e., the setup is different for a paired-samples t-test compared with a two-way ANOVA, or multiple regression, for example).


Select and Filter Data
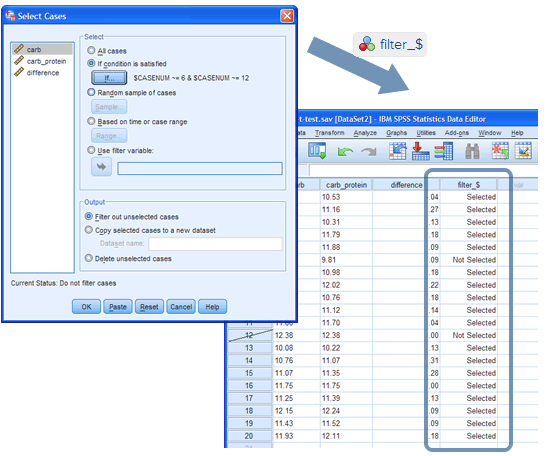
You rarely want to remove/delete data from your SPSS Statistics file, but there are a number of occasions when you need to filter that data before analysing it (e.g., to take into account missing data or outliers in your data set that could be negatively affecting your results). We show you, step-by-step, how to select different types of data (i.e., specific cases) and then filter your data set using the Select Cases function in SPSS Statistics.
Split Files
If you want to run the same statistical tests on different subgroups of your data set (e.g., running a t-test separately on males and females), you may need to "split" the file that you're working with to do this. We show you, step-by-step, how to use the Split File function in SPSS Statistics for single and multiple variables to make it easier for you to analyse your data.


Reverse Coding
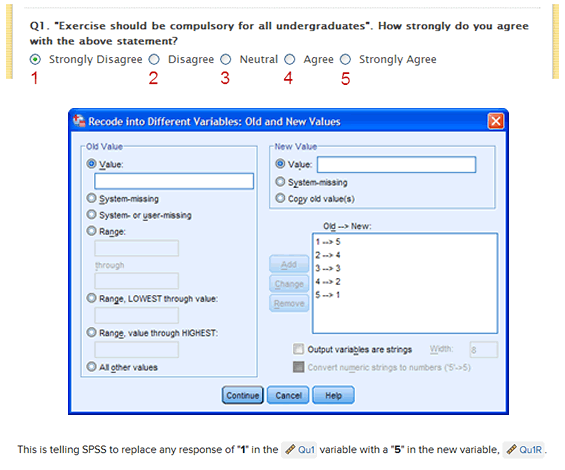
There are many reasons why a variable may need to be reverse coded, but it is most common when you have collected your data using a questionnaire/survey where respondents were asked their opinions/attitudes to questions/statements using a Likert scale (e.g., a scale from "strongly agree" to "strongly disagree"). In such cases, you sometimes need to change how the data is coded before you can analyse it. We explain more about this in our reverse coding guide, as well as show you, step-by-step, how to reverse code a variable using the Recode into Different Variables function in SPSS Statistics.
Weighting cases
Sometimes the data you want to analyse has already been summarised. This is common when collecting secondary data. For example, a questionnaire was completed by 21 people, asking if they (a) smoked and (b) exercised regularly. You don't have the data that shows how each person responded to these two questions, but only the total counts (e.g., 12 people smoked/9 people didn't smoke; 5 people exercised regularly/16 people didn't). To test whether there is an association between these two variables (smoking and regular exercise), you could run a Chi-square test of association using SPSS Statistics. However, you can't simply analyse the data as you would normally in SPSS Statistics because it has already been summarised. Instead, you need to use the Weight Cases function. We show you how to do this, step-by-step.
