Two-way MANOVA in SPSS Statistics
Introduction
The two-way multivariate analysis of variance (two-way MANOVA) is often considered as an extension of the two-way ANOVA for situations where there is two or more dependent variables. The primary purpose of the two-way MANOVA is to understand if there is an interaction between the two independent variables on the two or more dependent variables.
For example, you could use a two-way MANOVA to understand whether there were differences in students' short-term and long-term recall of facts based on lecture duration and fact type (i.e., the two dependent variables are "short-term memory recall" and "long-term memory recall", whilst the two independent variables are "lecture duration", which has four groups – "30 minutes", "60 minutes", "90 minutes" and "120 minutes" – and "fact type", which has two groups: "quantitative (numerical) facts" and "qualitative (textual/contextual) facts"). Alternately, you could use a two-way MANOVA to understand whether there were differences in the effectiveness of male and female police officers in dealing with violent crimes and crimes of a sexual nature taking into account a citizen's gender (i.e., the two dependent variables are "perceived effectiveness in dealing with violent crimes" and "perceived effectiveness in dealing with sexual crimes", whilst the two independent variables are "police officer gender", which has two categories – "male police officers" and "female police offices" – and "citizen gender", which also has two categories: "male citizens" and "female citizens").
As mentioned earlier, a two-way MANOVA has generally one primary aim: to understand whether the effect of one independent variable on the dependent variables (collectively) is dependent on the value of the other independent variable. This is called an "interaction effect". However, if no interaction effect is present (usually assessed as whether the interaction effect is statistically significant), you would normally be interested in the "main effects" of each independent variable instead. This is somewhat akin to assessing the effect that an independent variable has on the dependent variables collectively when "ignoring" the value of the other independent variable. On the other hand, if a statistically significant interaction is found, you need to consider an method of following up the result (i.e., what follow-up analyses you may want to run).
In this "quick start" guide, we show you how to carry out a two-way MANOVA using SPSS Statistics, as well as interpret and report the results from this test. However, before we introduce you to this procedure, you need to understand the different assumptions that your data must meet in order for a two-way MANOVA to give you a valid result. We discuss these assumptions next.
SPSS Statistics
Basic requirements and assumptions of the two-way MANOVA
When you choose to analyse your data using a two-way MANOVA, part of the process involves checking to make sure that the data you want to analyse can actually be analysed using a two-way MANOVA. You need to do this because it is only appropriate to use a two-way MANOVA if your data "passes" nine assumptions that are required for a two-way MANOVA to give you a valid result. Do not be surprised if, when analysing your own data using SPSS Statistics, one or more of these assumptions is violated (i.e., is not met). This is not uncommon when working with real-world data. However, even when your data fails certain assumptions, there is often a solution to overcome this.
In practice, checking for these nine assumptions adds some more time to your analysis, requiring you to work through additional procedures in SPSS Statistics when performing your analysis, as well as thinking a little bit more about your data. These nine assumptions are presented below:
- Assumption #1: Your two or more dependent variables should be measured at the interval or ratio level (i.e., they are continuous). Examples of continuous variables include revision time (measured in hours), intelligence (measured using IQ score), exam performance (measured from 0 to 100), weight (measured in kg), and so forth. You can learn more about interval and ratio variables in our article: Types of Variable.
- Assumption #2: Your two independent variables should consist of two or more categorical, independent groups. Example independent variables that meet this criterion include ethnicity (e.g., 3 groups: Caucasian, African American and Hispanic), physical activity level (e.g., 4 groups: sedentary, low, moderate and high), profession (e.g., 5 groups: surgeon, doctor, nurse, dentist, therapist), and so forth.
- Assumption #3: You should have independence of observations, which means that there is no relationship between the observations in each group or between the groups themselves. For example, there must be different participants in each group with no participant being in more than one group. This is more of a study design issue than something you can test for, but it is an important assumption of the two-way MANOVA.
- Assumption #4: You should have an adequate sample size. Although the larger your sample size, the better; for MANOVA, you need to have more cases in each group than the number of dependent variables you are analysing.
- Assumption #5: There are no univariate or multivariate outliers. First, there can be no (univariate) outliers in all combinations of groups of your two independent variables for any of the dependent variables. This is a similar assumption to the two-way ANOVA, but for each dependent variable that you have in your MANOVA analysis. Univariate outliers are often just called outliers and are the same type of outliers you will have come across if you have conducted t-tests or ANOVAs. We refer to them as univariate in this guide to distinguish them from multivariate outliers. Multivariate outliers are cases which have an unusual combination of scores on the dependent variables. You can detect univariate outliers in SPSS Statistics using boxplots and check for multivariate outliers using a measure called Mahalanobis distance, which you can also do using SPSS Statistics.
- Assumption #6: There is multivariate normality. Unfortunately, multivariate normality is a particularly tricky assumption to test for and cannot be directly tested in SPSS Statistics. Instead, normality of each of the dependent variables for all combinations of the groups of your two independent variables is often used in its place as a best 'guess' as to whether there is multivariate normality. You can test for this using the Shapiro-Wilk test of normality, which is easily tested for using SPSS Statistics.
- Assumption #7: There is a linear relationship between each pair of dependent variables for all combinations of groups of your two independent variables. If the variables are not linearly related, the power of the test is reduced. You can test for this assumption by plotting a scatterplot matrix for all combinations of group of your two independent variables. In order to do this, you will need to split your data file in SPSS Statistics before generating the scatterplot matrices.
- Assumption #8: There is homogeneity of variance-covariance matrices. You can test this assumption in SPSS Statistics using Box's M Test of Equality of Covariance Matrices. Despite the importance of this assumption for a two-way MANOVA, if your data fails this assumption, there are a number of ways to proceed with your analysis.
- Assumption #9: There is no multicollinearity. Ideally, you want your dependent variables to be moderately correlated with each other. If the correlations are low, you might be better off running separate one-way ANOVAs, and if the correlation(s) are too high (greater than 0.9), you could have a multicollinearity problem. This is problematic for MANOVA and needs to be screened out.
You can check assumptions #5, #6, #7, #8 and #9 using SPSS Statistics. Before doing this, you should make sure that your data meets assumptions #1, #2, #3 and #4, although you don't need SPSS Statistics to do this. Just remember that if you do not run the statistical tests on these assumptions correctly, the results you get when running a two-way MANOVA might not be valid.
In the section, Test Procedure in SPSS Statistics, we illustrate the SPSS Statistics procedure to perform a two-way MANOVA assuming that no assumptions have been violated. First, we set out the example we use to explain the two-way MANOVA procedure in SPSS Statistics.
SPSS Statistics
Example used in this guide and data setup in SPSS Statistics
Consider an experiment where three teaching methods were being trialled in schools. The three teaching methods were called "Regular", "Rote" and "Reasoning". The researchers primarily wanted to know whether the effects of the three teaching methods on students' grades in these two subjects were different based on students' gender (i.e., "male" and "female" students).
The primary aim is to determine whether there is a statistically significant interaction effect. This is usually given first priority in a two-way MANOVA analysis because its result will determine how to follow up the two-way MANOVA analysis and make sure that your results are not misleading or incomplete. Assuming that a statistically significant interaction effect is found, this indicates that the three teaching methods have different effects in male and female students (i.e., the effect of teaching methods on humanities and science grades depends on students' gender). Whether you find a statistically significant interaction will determine which effects in the two-way MANOVA you should interpret and what follow-up analyses you may want to run.
Therefore, in this study the two continuous dependent variables were "Humanities score" and "Science score", whilst the two nominal independent variables were "intervention", which reflected the teaching methods (i.e., consisting of three groups: "Regular", "Rote" and "Reasoning") and "gender" (i.e., consisting of two groups: "males" and "females").
In SPSS Statistics, we create four variables: (a) the continuous dependent variable, Humanities_Score; (b) the continuous dependent variable, Science_Score; (c) the nominal independent variable, Intervention; and (d) the nominal independent variable, Gender.
Note: We would also recommend that you create a fifth variable, subject_id, to act as a case number. This variable is required to test whether there are any multivariate outliers (i.e., part of Assumption #5 above). We do not include it in the test procedure in the next section because we do not show you how to test for the assumptions of the two-way MANOVA in this "quick start" guide.
SPSS Statistics
SPSS Statistics procedure to carry out a two-way MANOVA
The six steps below show you how to analyse your data using a two-way MANOVA in SPSS Statistics when the nine assumptions in the previous section, Assumptions, have not been violated. These steps are appropriate up to the latest versions of SPSS Statistics, which are version 30 and the subscription version of SPSS Statistics. At the end of these six steps, we show you how to interpret the results from this test.
Note: Since some of the options in the General Linear Model > Multivariate... procedure changed in SPSS Statistics version 25, we include the screenshots for version 24 and earlier versions of SPSS Statistics as well. Therefore, any differences in screenshots for version 24 and earlier versions in the six steps below are shown in the yellow notes (like this one) at the end of each step. If you are unsure which version of SPSS Statistics you are using, see our guide: Identifying your version of SPSS Statistics.
Note: In version 27 and the subscription version, SPSS Statistics introduced a new look to their interface called "SPSS Light", replacing the previous look for versions 26 and earlier versions, which was called "SPSS Standard". Therefore, if you have versions 27 to 30 (or the subscription version), the images that follow will be light grey rather than blue. However, the procedure for versions 25 to 30, as well as the subscription version, are identical.
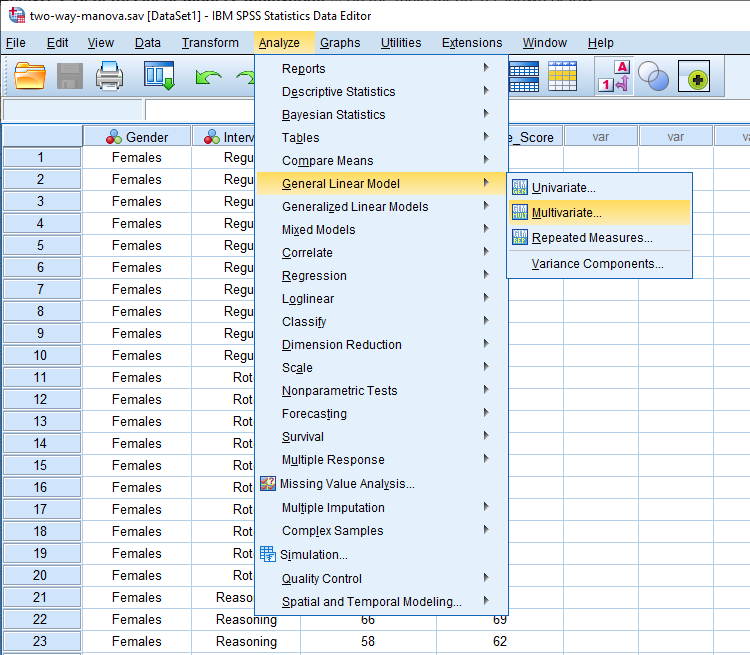
- Click Analyze > General Linear Model > Multivariate... on the main menu, as shown below:

Published with written permission from SPSS Statistics, IBM Corporation.
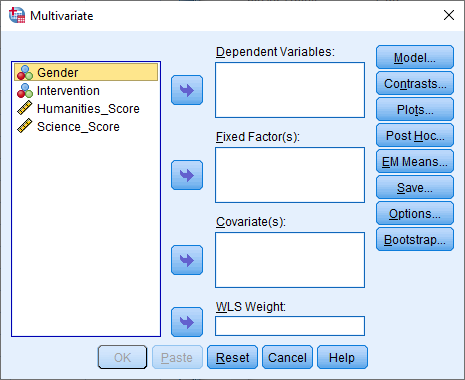
You will be presented with the Multivariate dialogue box, as shown below:
Published with written permission from SPSS Statistics, IBM Corporation.
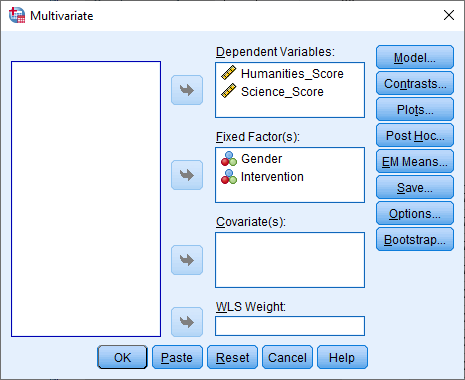
- Transfer the dependent variables, Humanities_Score and Science_Score, into the the Dependent Variables: box, and the independent variables, Gender and Intervention, into the Fixed Factor(s): box using the appropriate buttons. You will end up with a screen similar to the following:
Published with written permission from SPSS Statistics, IBM Corporation.
Note: For this analysis, you will not need to use the Covariate(s): box (used for MANCOVA) or the WLS Weight: box.
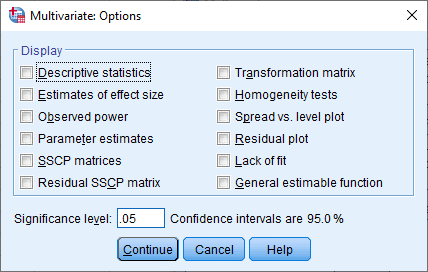
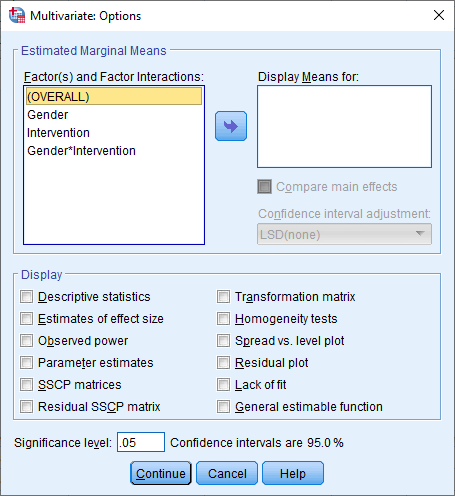
- Click on the button. You will be presented with the Multivariate: Options dialogue box, as shown below:
Published with written permission from SPSS Statistics, IBM Corporation.
Note: If you have SPSS Statistics version 24 or an earlier version of SPSS Statistics, you will be presented with the following Multivariate: Options dialogue box:
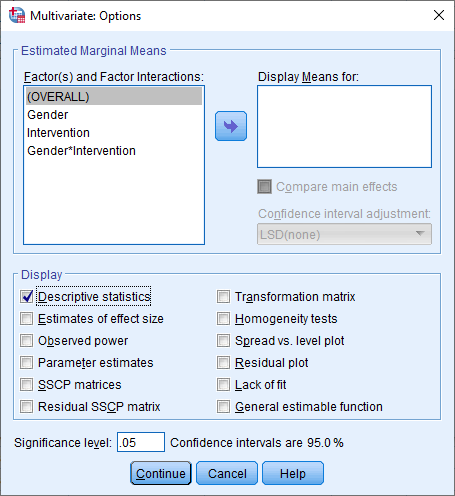
- Select the Descriptive statistics checkbox in the –Display– area. You will be presented with the following screen:
Published with written permission from SPSS Statistics, IBM Corporation.
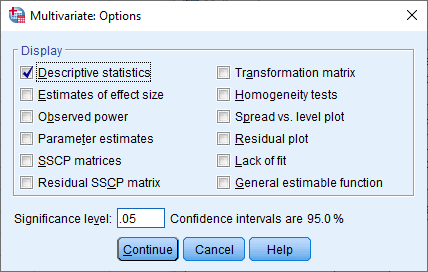
Note: If you have SPSS Statistics version 24 or an earlier version of SPSS Statistics, select the Descriptive statistics checkbox in the –Display– area. You will be presented with the following screen:
- Click on the button. This will return you to the Multivariate dialogue box.
- Click on the button to generate the output.
SPSS Statistics
Interpreting the results of the two-way MANOVA
SPSS Statistics produces many different tables in its two-way MANOVA analysis. In this "quick start" guide, we focus only on the two main tables you need to understand your two-way MANOVA results, assuming that your data has already met the nine assumptions required for a two-way MANOVA to give you a valid result.
SPSS Statistics
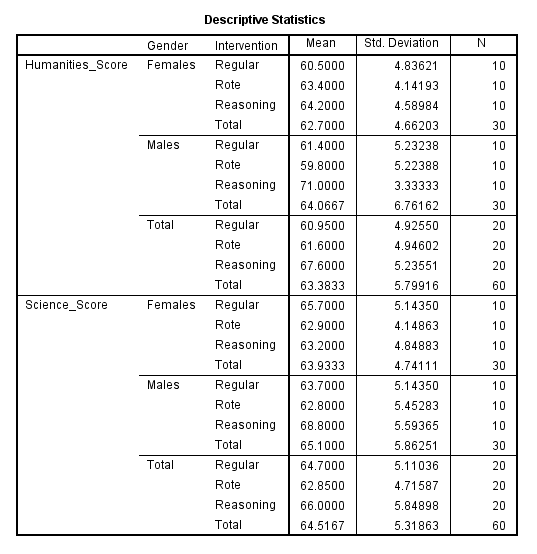
Descriptive Statistics
The Descriptive Statistics table is very useful because it provides the mean and standard deviation for the two dependent variables, which have been split by the groups of the two independent variables. The Descriptive Statistics table is presented below:
Published with written permission from SPSS Statistics, IBM Corporation.
SPSS Statistics
Multivariate Tests
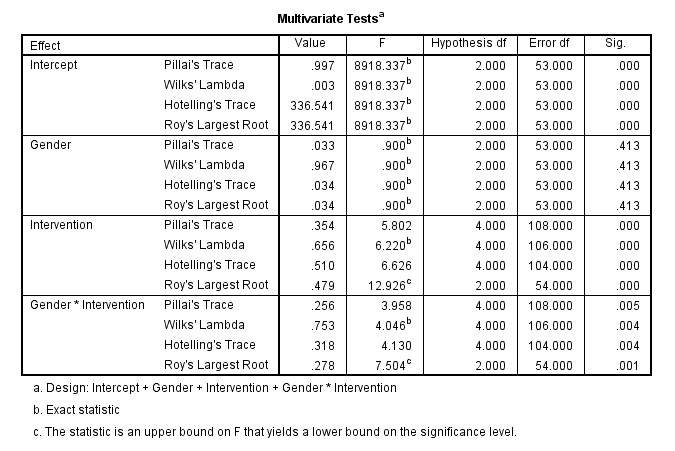
The first result that needs to be interpreted in the two-way MANOVA is the interaction term (i.e., Gender*Intervention), which is found in the Multivariate Tests table, as shown below:
Published with written permission from SPSS Statistics, IBM Corporation.
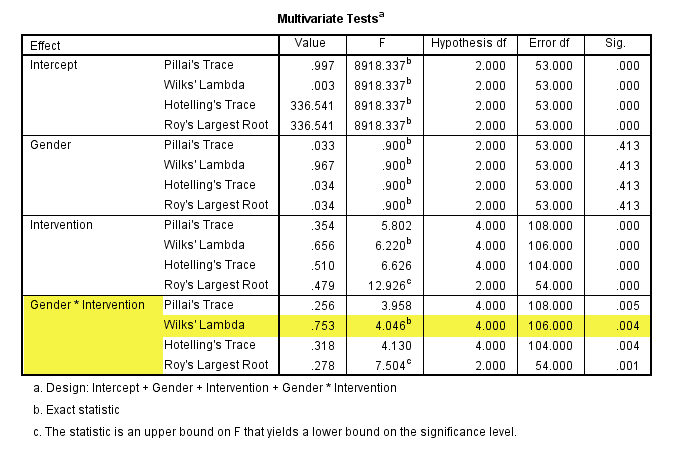
The different names given to each row (namely, Pillai's Trace, Wilks' Lambda, Hotelling's Trace and Roy's Largest Root) are the names of the different multivariate test statistics that can be used to test the statistical significance of the different effects of the independent variables. Each test statistic will provide you with a statistical significance value (i.e., p-value), but its value can be different for the different test statistics. As such, you have the added complication of having to decide which multivariate test statistic to use, especially if they provide different conclusions (although this is not very common). The most commonly recommended multivariate statistic to use is Wilks' Lambda (Λ) and this is what will be used in this example, but the recommended multivariate statistic will vary based on factors such as whether you have unequal sample sizes. The interaction effect is highlighted below:
Published with written permission from SPSS Statistics, IBM Corporation.
The interaction effect can be interpreted in a similar manner to an interaction in a two-way ANOVA. That is, the interaction effect determines whether the effect of gender is consistent across the different interventions. Alternatively, but equivalently, the interaction effect determines whether the effect of the interventions is similar for males and females. If the interaction effect is statistically significant, you will have a p-value (value in the "Sig." column) less than .05 (i.e., p < .05). Alternatively, if p > .05, the interaction effect is not statistically significant.
You can see that p = .004 (i.e., the Wilks' Lambda row highlighted in yellow), which means that there is a statistically significant interaction effect. This means that the effect of the intervention on the dependent variables is not the same for males and females.
Whether you achieve a statistically significant interaction effect will determine how you follow up your results. For example, if you did not get a statistically significant effect you would most likely report the main effects of gender and intervention.
SPSS Statistics
Reporting the results of the two-way MANOVA
You could report the result of this test as follows:
There was a statistically significant interaction effect between gender and type of intervention on the combined dependent variables, F(4, 106) = 4.046, p = .004; Wilks' Λ = .753.