Login

Two-way ANOVA in SPSS Statistics

Introduction

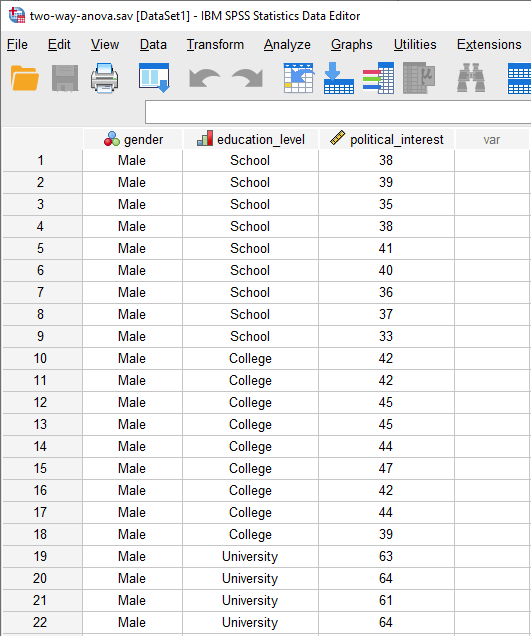
The two-way ANOVA compares the mean differences between groups that have been split on two independent variables (called factors). The primary purpose of a two-way ANOVA is to understand if there is an interaction between the two independent variables on the dependent variable. For example, you could use a two-way ANOVA to understand whether there is an interaction between gender and educational level on test anxiety amongst university students, where gender (males/females) and education level (undergraduate/postgraduate) are your independent variables, and test anxiety is your dependent variable. Alternately, you may want to determine whether there is an interaction between physical activity level and gender on blood cholesterol concentration in children, where physical activity (low/moderate/high) and gender (male/female) are your independent variables, and cholesterol concentration is your dependent variable.

The interaction term in a two-way ANOVA informs you whether the effect of one of your independent variables on the dependent variable is the same for all values of your other independent variable (and vice versa). For example, is the effect of gender (male/female) on test anxiety influenced by educational level (undergraduate/postgraduate)? Additionally, if a statistically significant interaction is found, you need to determine whether there are any "simple main effects", and if there are, what these effects are (we discuss this later in our guide).

Note: If you have three independent variables rather than two, you need a three-way ANOVA. Alternatively, if you have a continuous covariate, you need a two-way ANCOVA.

In this "quick start" guide, we show you how to carry out a two-way ANOVA using SPSS Statistics, as well as interpret and report the results from this test. However, before we introduce you to this procedure, you need to understand the different assumptions that your data must meet in order for a two-way ANOVA to give you a valid result. We discuss these assumptions next.

SPSS Statistics

Assumptions

When you choose to analyse your data using a two-way ANOVA, part of the process involves checking to make sure that the data you want to analyse can actually be analysed using a two-way ANOVA. You need to do this because it is only appropriate to use a two-way ANOVA if your data "passes" six assumptions that are required for a two-way ANOVA to give you a valid result. In practice, checking for these six assumptions means that you have a few more procedures to run through in SPSS Statistics when performing your analysis, as well as spend a little bit more time thinking about your data, but it is not a difficult task.

Before we introduce you to these six assumptions, do not be surprised if, when analysing your own data using SPSS Statistics, one or more of these assumptions is violated (i.e., is not met). This is not uncommon when working with real-world data rather than textbook examples, which often only show you how to carry out a two-way ANOVA when everything goes well! However, don’t worry. Even when your data fails certain assumptions, there is often a solution to overcome this. First, let’s take a look at these six assumptions:

You can check assumptions #4, #5 and #6 using SPSS Statistics. Before doing this, you should make sure that your data meets assumptions #1, #2 and #3, although you don’t need SPSS Statistics to do this. Just remember that if you do not run the statistical tests on these assumptions correctly, the results you get when running a two-way ANOVA might not be valid. This is why we dedicate a number of sections of our enhanced two-way ANOVA guide to help you get this right. You can find out about our enhanced content as a whole on our Features: Overview page, or more specifically, learn how we help with testing assumptions on our Features: Assumptions page.

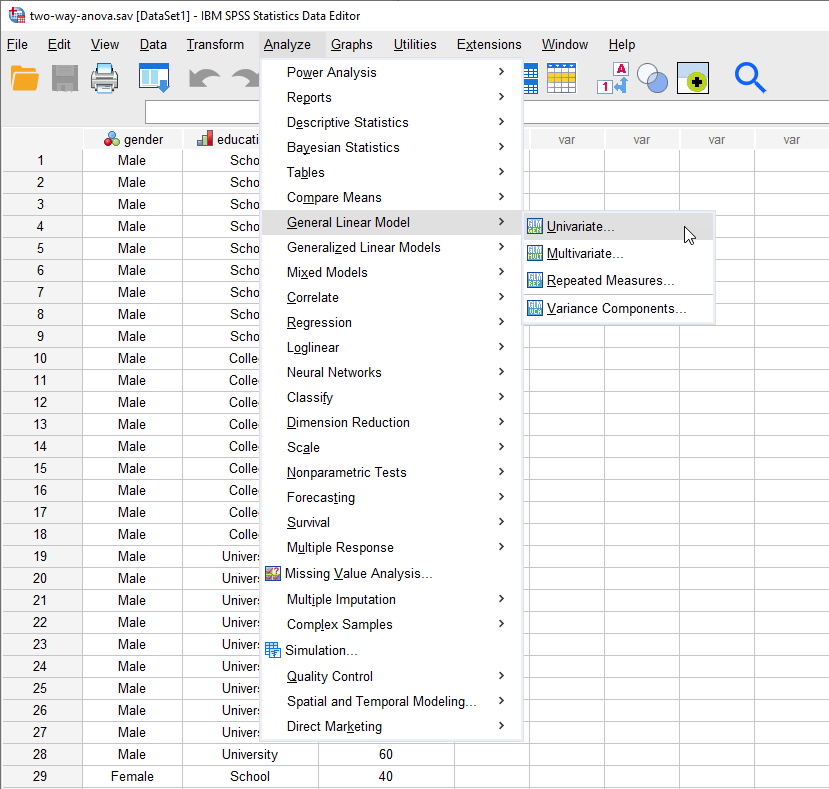
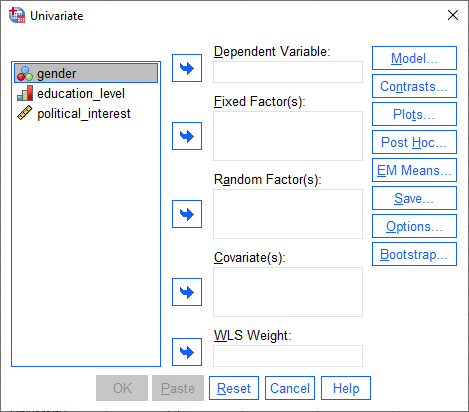
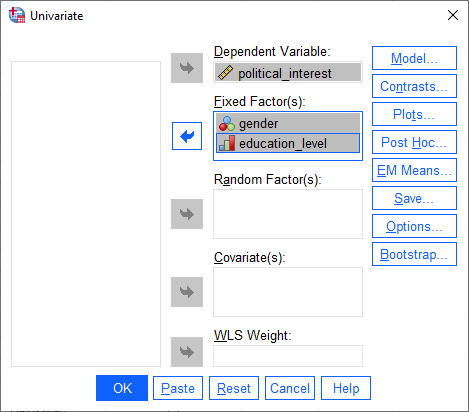
In the section, Test Procedure in SPSS Statistics, we illustrate the SPSS Statistics procedure to perform a two-way ANOVA assuming that no assumptions have been violated. First, we set out the example we use to explain the two-way ANOVA procedure in SPSS Statistics.

Testimonials
TAKE THE TOUR


SPSS Statistics

Example

A researcher was interested in whether an individual's interest in politics was influenced by their level of education and gender. They recruited a random sample of participants to their study and asked them about their interest in politics, which they scored from 0 to 100, with higher scores indicating a greater interest in politics. The researcher then divided the participants by gender (Male/Female) and then again by level of education (School/College/University). Therefore, the dependent variable was "interest in politics", and the two independent variables were "gender" and "education".

SPSS Statistics

Setup in SPSS Statistics

A researcher had previously discovered that interest in politics is influenced by level of education. When participants were classified into three groups according to their highest level of education; namely "school", "college" or "university", in that order; higher education levels were associated with a greater interest in politics. Having demonstrated this, the researcher was now interested in determining whether this effect of education level on interest in politics was different for males and females (i.e., different depending on your gender). To answer this question, they recruited 60 participants: 30 males and 30 females, equally split by level of education (School/College/University) (i.e., 10 participants in each group). The researcher had participants complete a questionnaire that assessed their interest in politics, which they called the "Political Interest" scale. Participants could score anything between 0 and 100, with higher scores indicating a greater interest in politics.

In SPSS Statistics, we separated the individuals into their appropriate groups by using two columns representing the two independent variables, and labelled them gender and education_level. For gender, we coded "males" as 1 and "females" as 2, and for education_level, we coded "school" as 1, "college" as 2 and "university" as 3. The participants' interest in politics – the dependent variable – was entered under the variable name, political_interest. The setup for this example can be seen below:

Data setup for a two-way ANOVA in SPSS

Published with written permission from SPSS Statistics, IBM Corporation.

If you are still unsure how to correctly set up your data in SPSS Statistics to carry out a two-way ANOVA, we show you all the required steps in our enhanced two-way ANOVA guide.

SPSS Statistics

SPSS Statistics procedure for the two-way ANOVA

The General Linear Model > Univariate... procedure below shows you how to analyse your data using a two-way ANOVA in SPSS Statistics when the six assumptions in the previous section, Assumptions, have not been violated. At the end of these 14 steps, we show you how to interpret the results from this test. If you are looking for help to make sure your data meets assumptions #4, #5 and #6, which are required when using a two-way ANOVA and can be tested using SPSS Statistics, you can learn more in our enhanced guides on our Features: Overview page.

Since some of the options in the General Linear Model > Univariate... procedure changed in SPSS Statistics version 25, we show how to carry out a two-way ANOVA depending on whether you have SPSS Statistics versions 25, 26, 27 or 28 (or the subscription version of SPSS Statistics) or version 24 or an earlier version of SPSS Statistics. The latest versions of SPSS Statistics are version 28 and the subscription version. If you are unsure which version of SPSS Statistics you are using, see our guide: Identifying your version of SPSS Statistics.

SPSS Statistics versions 25, 26, 27 and 28
(and the subscription version of SPSS Statistics)
  1. Click Analyze > General Linear Model > Univariate... on the top menu, as shown below:

    Note: In version 27, SPSS Statistics introduced a new look to their interface called "SPSS Light", replacing the previous look for versions 26 and earlier versions, which was called "SPSS Standard". Therefore, if you have SPSS Statistics versions 27 or 28 (or the subscription version of SPSS Statistics), the images that follow will be light grey rather than blue. However, the procedure is identical.

    Two-way ANOVA Menu

    Published with written permission from SPSS Statistics, IBM Corporation.


    You will be presented with the Univariate dialogue box, as shown below:
    Two-way ANOVA Dialogue Box

    Published with written permission from SPSS Statistics, IBM Corporation.

  2. Transfer the dependent variable, political_interest, into the Dependent Variable: box, and the independent variables, gender and education_level, into the Fixed Factor(s): box, using the relevant Right Arrow buttons, as shown below:
    Two-way ANOVA Dialogue Box

    Published with written permission from SPSS Statistics, IBM Corporation.

  3. Click on the Plots button. You will be presented with the Univariate: Profile Plots dialogue box, as shown below:
    Two-way ANOVA Plots Dialogue Box

    Published with written permission from SPSS Statistics, IBM Corporation.

  4. Transfer gender from the Factors: box to the Separate Lines: box and education_level into the Horizontal Axis: box, as shown below:
    Two-way ANOVA Plots Dialogue Box

    Published with written permission from SPSS Statistics, IBM Corporation.

  5. Click on the Add button. This will add this profile plot, which it labels "education_level*gender", into the Plots: box, as shown below:
    Two-way ANOVA Plots Dialogue Box

    Published with written permission from SPSS Statistics, IBM Corporation.

  6. Transfer education_level from the Factors: box to the Separate Lines: box and gender into the Horizontal Axis: box, as shown below:
    Two-way ANOVA Plots Dialogue Box

    Published with written permission from SPSS Statistics, IBM Corporation.

  7. Click on the Add button. This will add this profile plot, which it labels "gender*education_level", into the Plots: box, as shown below:
    Two-way ANOVA Plots Dialogue Box

    Published with written permission from SPSS Statistics, IBM Corporation.

  8. Click on the Continue button. You will be returned to the Univariate dialogue box.
  9. Click on the EM Means button. You will be presented with the Univariate: Estimated Marginal Means dialogue box, as shown below:
    Two-way ANOVA Estimated Marginal Means Dialogue Box

    Published with written permission from SPSS Statistics, IBM Corporation.

    Note: If you have SPSS Statistics versions 25, 26 or 27, the Univariate: Estimated Marginal Means dialogue box will look like the one below:

    Two-way ANOVA Estimated Marginal Means Dialogue Box

  10. Transfer the interaction effect, "gender*education_level", from the Factor(s) and Factor Interactions: box to the Display Means for: box by highlighting it and clicking on the Right Arrow button, as shown below:
    Two-way ANOVA Estimated Marginal Means Transferred

    Published with written permission from SPSS Statistics, IBM Corporation.

    Note: If you have SPSS Statistics versions 25, 26 or 27, the Univariate: Estimated Marginal Means dialogue box will now look like the one below:

    Two-way ANOVA Estimated Marginal Means Transferred

  11. Click on the Continue button. You will be returned to the Univariate dialogue box.
  12. Click on the Post Hoc button. You will be presented with the Univariate: Post Hoc Multiple Comparisons for Observed Means dialogue box, as shown below:
    Two-way ANOVA Post Hoc Dialogue Box

    Published with written permission from SPSS Statistics, IBM Corporation.

  13. Transfer education_level from the Factor(s): box to the Post Hoc Tests for: box using the Right Arrow button. This will activate the –Equal Variances Assumed– area (i.e., it will no longer be greyed out) and present you with some choices for which post hoc test to use. For this example, we are going to select Tukey, which is a good, all-round post hoc test.

    Note: You only need to transfer independent variables that have more than two groups into the Post Hoc Tests for: box. This is why we do not transfer gender.

    Two-way ANOVA Post Hoc Variables Transferred

    Published with written permission from SPSS Statistics, IBM Corporation.

  14. Click on the Continue button. You will be returned to the Univariate dialogue box.
  15. Click on the Options button. You will be presented with the Univariate: Options dialogue box, as shown below:
    Two-way ANOVA Options Dialogue Box

    Published with written permission from SPSS Statistics, IBM Corporation.

  16. Select the Descriptive statistics option in the –Display– area. You will end up with the following screen:
    Two-way ANOVA Options Options Transferred

    Published with written permission from SPSS Statistics, IBM Corporation.

  17. Click on the Continue button. You will be returned to the Univariate dialogue box.
  18. Click on the OK button.

Go to the next page for the SPSS Statistics output, discussion of simple main effects and an explanation of the output. You can ignore the section below, which shows you how to carry out a two-way ANOVA when you have SPSS Statistics version 24 or an earlier version of SPSS Statistics.

Join the 10,000s of students, academics and professionals who rely on Laerd Statistics.TAKE THE TOUR
SPSS Statistics version 24
and earlier versions of SPSS Statistics
  1. Click Analyze > General Linear Model > Univariate... on the top menu, as shown below:
    Two-way ANOVA Menu

    Published with written permission from SPSS Statistics, IBM Corporation.


    You will be presented with the Univariate dialogue box, as shown below:
    Two-way ANOVA Dialogue Box

    Published with written permission from SPSS Statistics, IBM Corporation.

  2. Transfer the dependent variable, political_interest, into the Dependent Variable: box, and the independent variables, gender and education_level, into the Fixed Factor(s): box, using the relevant Right Arrow buttons, as shown below:
    Two-way ANOVA Dialogue Box

    Published with written permission from SPSS Statistics, IBM Corporation.

  3. Click on the Plots button. You will be presented with the Univariate: Profile Plots dialogue box, as shown below:
    Two-way ANOVA Plots Dialogue Box

    Published with written permission from SPSS Statistics, IBM Corporation.

  4. Transfer gender from the Factors: box to the Separate Lines: box and education_level into the Horizontal Axis: box, as shown below:
    Two-way ANOVA Plots Dialogue Box

    Published with written permission from SPSS Statistics, IBM Corporation.

  5. Click on the Add button. This will add this profile plot, which it labels "education_level*gender", into the Plots: box, as shown below:
    Two-way ANOVA Plots Dialogue Box

    Published with written permission from SPSS Statistics, IBM Corporation.

  6. Transfer education_level from the Factors: box to the Separate Lines: box and gender into the Horizontal Axis: box, as shown below:
    Two-way ANOVA Plots Dialogue Box

    Published with written permission from SPSS Statistics, IBM Corporation.

  7. Click on the Add button. This will add this profile plot, which it labels "gender*education_level", into the Plots: box, as shown below:
    Two-way ANOVA Plots Dialogue Box

    Published with written permission from SPSS Statistics, IBM Corporation.

  8. Click on the Continue button. You will be returned to the Univariate dialogue box.
  9. Click on the Options button. You will be presented with the Univariate: Options dialogue box, as shown below:
    Two-way ANOVA Options Dialogue Box

    Published with written permission from SPSS Statistics, IBM Corporation.

  10. Transfer the interaction effect, "gender*education_level", from the Factor(s) and Factor Interactions: box to the Display Means for: box by highlighting it and clicking on the Right Arrow button. Then, select the Descriptive statistics option in the –Display– area. You will end up with the following screen:
    Two-way ANOVA Options Options Transferred

    Published with written permission from SPSS Statistics, IBM Corporation.

  11. Click on the Continue button. You will be returned to the Univariate dialogue box.
  12. Click on the Post Hoc button. You will be presented with the Univariate: Post Hoc Multiple Comparisons for Observed Means dialogue box, as shown below:
    Two-way ANOVA Post Hoc Dialogue Box

    Published with written permission from SPSS Statistics, IBM Corporation.

  13. Transfer education_level from the Factor(s): box to the Post Hoc Tests for: box using the Right Arrow button. This will activate the –Equal Variances Assumed– area (i.e., it will no longer be greyed out) and present you with some choices for which post hoc test to use. For this example, we are going to select Tukey, which is a good, all-round post hoc test.

    Note: You only need to transfer independent variables that have more than two groups into the Post Hoc Tests for: box. This is why we do not transfer gender.

    Two-way ANOVA Post Hoc Variables Transferred

    Published with written permission from SPSS Statistics, IBM Corporation.

  14. Click on the Continue button. You will be returned to the Univariate dialogue box.
  15. Click on the OK button.

Go to the next page for the SPSS Statistics output, discussion of simple main effects and an explanation of the output.

next »