One-way MANCOVA in SPSS Statistics
Introduction
The one-way multivariate analysis of covariance (MANCOVA) can be thought of as an extension of the one-way MANOVA to incorporate a covariate or an extension of the one-way ANCOVA to incorporate multiple dependent variables. This covariate is linearly related to the dependent variables and its inclusion into the analysis can increase the ability to detect differences between groups of an independent variable. A one-way MANCOVA is used to determine whether there are any statistically significant differences between the adjusted means of three or more independent (unrelated) groups, having controlled for a continuous covariate.
For example, you could use a one-way MANCOVA to determine whether a number of different exam performances differed based on test anxiety levels amongst students, whilst controlling for revision time (i.e., your dependent variables would be "humanities exam performance", "science exam performance" and "mathematics exam performance", all measured from 0-100, your independent variable would be "test anxiety level", which has three groups – "low-stressed students", "moderately-stressed students" and "highly-stressed students" – and your covariate would be "revision time", measured in hours). You want to control for revision time because you believe that the effect of test anxiety levels on overall exam performance will depend, to some degree, on the amount of time students spend revising.
The one-way MANCOVA is very useful, but it is important to realize that the one-way MANCOVA is an omnibus test statistic. It will tell you whether the groups of the independent variable statistically significantly differed based on the combined dependent variables, after adjusting for the covariate, but it will not explain the result further. In other words, the one-way MANCOVA will not tell you about the differences between specific groups. Using the example above, a statistically significant one-way MANCOVA would indicate that there is a difference in test anxiety levels on the combined scores from the three exams (i.e., the humanities, science and mathematics exams). However, it will not indicate whether low-stressed students scored higher on the combined exam scores than higher stressed students, or even more specifically, whether low-stressed students scored higher on a specific exam (e.g., the science exam) compared to highly-stressed students. That said, there are follow-up tests (known as post hoc tests) that can be used to determine where these differences between groups are, which we discuss at the end of this guide.
In this "quick start" guide, we show you how to carry out a one-way MANCOVA using SPSS Statistics, as well as interpret and report the results from this test. However, before we introduce you to this procedure, you need to understand the different assumptions that your data must meet in order for a one-way MANCOVA to give you a valid result. We discuss these assumptions next.
SPSS Statistics
Basic requirements and assumptions of a one-way MANCOVA
When you choose to analyse your data using a one-way MANCOVA, a critical part of the process involves checking to make sure that the data you want to analyse can actually be analysed using a one-way MANCOVA. You need to do this because it is only appropriate to use a one-way MANCOVA if your data "passes" 11 assumptions that are required for a one-way MANCOVA to give you a valid result. Do not be surprised if, when analysing your own data using SPSS Statistics, one or more of these assumptions is violated (i.e., is not met). This is not uncommon when working with real-world data. However, even when your data fails certain assumptions, there is often a solution to overcome this.
In practice, checking for these 11 assumptions is likely to be the the most time consuming part of your analysis, requiring you to work through additional procedures in SPSS Statistics when performing your analysis, as well as spending time thinking about your data and what to do if your data violates different assumptions. In the section below, these 11 assumptions are briefly set out:
- Assumption #1: Your two or more dependent variables should be measured at the interval or ratio level (i.e., they are continuous variables). Examples of continuous variables include revision time (measured in hours), intelligence (measured using IQ score), exam performance (measured from 0 to 100), weight (measured in kg), and so forth. You can learn more about interval and ratio variables in our article: Types of Variable.
- Assumption #2: Your one independent variable should consist of two or more categorical, independent groups (i.e., you have a nominal variable or an ordinal variable). Examples of nominal variables include gender (e.g., 2 groups: male and female), ethnicity (e.g., 3 groups: Caucasian, African American and Hispanic) and profession (e.g., 4 groups: surgeon, doctor, nurse and dentist). Examples of ordinal variables include cholesterol concentration (e.g., 2 groups: 5 mmol/L or below and above 5 mmol/L), physical activity level (e.g., 3 groups: low, moderate and high) and body mass index (e.g., 4 groups: underweight, normal, overweight, obese).
- Assumption #3: Your one or more covariates are all continuous variables (see Assumption #1 for examples of continuous variables). A covariate is simply a continuous independent variable that is added to a MANOVA model to produce a MANCOVA model. This covariate is used to adjust the means of the groups of the categorical independent variable. In a MANCOVA the covariate is generally only there to provide a better assessment of the differences between the groups of the categorical independent variable on the dependent variables.
- Assumption #4: You should have independence of observations, which means that there is no relationship between the observations in each group of the independent variable or between the groups themselves. For example, there must be different participants in each group of the independent variable with no participant being in more than one group. This is more of a study design issue than something you can test for, but it is an important assumption of the one-way MANCOVA.
- Assumption #5: There should be a linear relationship between each pair of dependent variables within each group of the independent variable. If the variables are not linearly related, the power of the test is reduced. You can test for this assumption by plotting a scatterplot matrix with loess lines of the dependent variables for each group of the independent variable. In order to do this, you will need to split your data file in SPSS Statistics before generating the scatterplot matrices.
- Assumption #6: There should be a linear relationship between the covariate and each dependent variable within each group of the independent variable. Similarly to Assumption #5 above, you can test for this assumption by plotting a scatterplot matrix with loess lines of the covariate for each of the dependent variables, for each group of the independent variable. You will again need to make sure that your data file is split in SPSS Statistics before generating the scatterplot matrices.
- Assumption #7: There should be homogeneity of regression slopes. This assumption states that the relationship between the covariate and each separate dependent variable, as assessed by the regression slope, is the same in each group of the independent variable. Simply put, Assumption #6 assessed whether the relationships were linear; this assumption now checks that these linear relationships are the same. You can test this assumption is SPSS Statistics.
- Assumption #8: There should be homogeneity of variances and covariances. In other words, the one-way MANCOVA assumes that the variances and covariances of the dependent variables are equal in all groups of the independent variable. You can test this assumption in SPSS Statistics using Box's M Test of Equality of Covariance Matrices.
- Assumption #9: There should be no significant univariate outliers in the groups of your independent variable in terms of each dependent variable. If there are any dependent variable scores that are unusual in any group of the independent variable, in that their value is extremely small or large compared to the other scores, these scores are called univariate outliers. Univariate outliers can have a large negative effect on your results because they can exert a large influence (i.e., can cause a large change) on the mean for that group, which can affect the statistical test results. Univariate outliers are more important to consider when you have smaller sample sizes, as the effect of the outlier will be greater. Univariate outliers can be detected by inspecting the standardized residuals that can be producing using SPSS Statistics.
- Assumption #10: There should be no significant multivariate outliers in the groups of your independent variable in terms of each dependent variable. Multivariate outliers are cases (e.g., participants in our example) that have an unusual combination of scores on the dependent variables within each group of the independent variable. SPSS Statistics can calculate a measure called Mahalanobis distance that can be used to determine whether a particular case might be a multivariate outlier.
- Assumption #11: There should be multivariate normality. Unfortunately, multivariate normality is a particularly tricky assumption to test for and cannot be directly tested in SPSS Statistics. Instead, normality of each of the residuals for each group of the independent variable is often used in its place as a best 'guess' as to whether there is multivariate normality. You can test for this using the Shapiro-Wilk test of normality in SPSS Statistics.
You can check assumptions #5, #6, #7, #8, #9, #10 and #11 using SPSS Statistics. Before doing this, you should make sure that your data meets assumptions #1, #2, #3 and #4, although you don't need SPSS Statistics to do this. Just remember that if you do not run the statistical tests on these assumptions correctly, the results you get when running the one-way MANCOVA might not be valid.
In the section, Test Procedure in SPSS Statistics, we illustrate the SPSS Statistics procedure to perform a one-way MANCOVA assuming that no assumptions have been violated. First, we set out the example we use to explain the one-way MANCOVA procedure in SPSS Statistics.
SPSS Statistics
Example used in this guide and data setup in SPSS Statistics
A researcher wanted to determine whether cardiovascular health was better for normal weight individuals with higher levels of physical activity (i.e., as opposed to more overweight individuals with lower physical activity levels). As such, the researcher recruited 120 participants who were subsequently divided into one of three groups depending on the amount of physical activity they performed: a group who were classified as engaging in a "low" amount of physical activity, a group who were classified as engaging in a "moderate" amount of physical activity, and a group who were classified as engaging in a "high" amount of physical activity. There were 40 participants in each group. In order to measure cardiovascular health, the researcher took three measurements from participants: (1) cholesterol concentration (measured in mmol/L), C-Reactive Protein (a marker of heart disease, measured in mg/L) and systolic blood pressure (i.e., the 140 in 140/80, measured in mmHg).
It was expected that increased levels of physical activity would have an overall beneficial effect on cardiovascular health, as measured by cholesterol concentration, C-Reactive Protein and systolic blood pressure. However, the researcher knows that body weight also effects cardiovascular health. As such, the researcher wanted to control for differences in the body weight of participants.
A one-way MANCOVA was carried out with cholesterol concentration, chol, C-Reactive Protein, crp, and systolic blood pressure, sbp, as the dependent variables, body weight as the covariate, weight, and the three physical activity groups – "low", "moderate" and "high" – as the groups of the independent variable, group.
In SPSS Statistics, we create five variables: (a) the three continuous dependent variables, chol, crp and sbp; (b) the categorical independent variable, group, which has three groups: "low", "moderate" and "high"; and the covariate, weight, which represents body weight. These variables need to be correctly set up in the Variable View and Data View windows of SPSS Statistics before you can carry out the one-way MANCOVA.
Note: You will also need to create one additional variable, id, to act as a case number. This variable is required to test whether there are any multivariate outliers (i.e., part of Assumption #10 above).
SPSS Statistics
SPSS Statistics procedure to carry out a one-way MANCOVA
The five steps below show you how to analyse your data using a one-way MANCOVA in SPSS Statistics when the 11 assumptions in the previous section, Assumptions, have not been violated. At the end of these five steps, we show you how to interpret the results from this test.
Note: Since some of the options in the General Linear Model > Multivariate... procedure changed in SPSS Statistics version 25, we include the screenshots for version 24 and earlier versions of SPSS Statistics as well. Therefore, any differences in screenshots for version 24 and earlier versions in the six steps below are shown in the yellow notes (like this one) at the end of each step. If you are unsure which version of SPSS Statistics you are using, see our guide: Identifying your version of SPSS Statistics.
Note: In version 27 and the subscription version, SPSS Statistics introduced a new look to their interface called "SPSS Light", replacing the previous look for versions 26 and earlier versions, which was called "SPSS Standard". Therefore, if you have versions 27 to 30 (or the subscription version), the images that follow will be light grey rather than blue. However, the procedure for versions 25 to 30, as well as the subscription version, are identical.
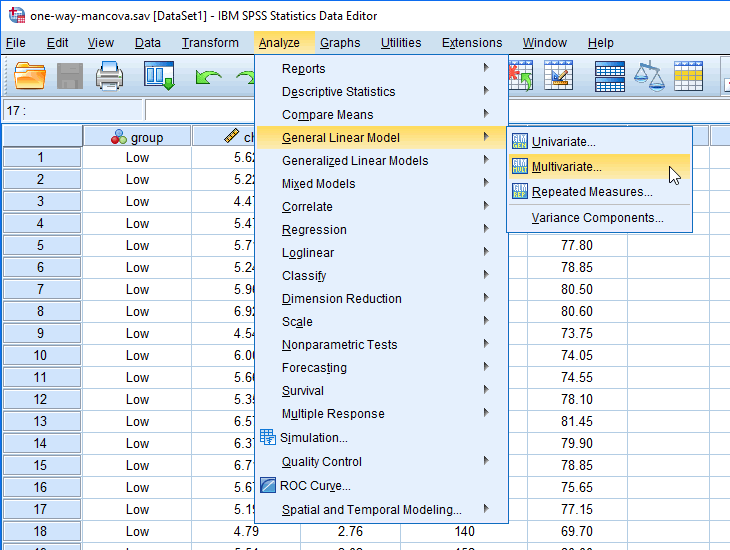
- Click Analyze > General Linear Model > Multivariate... on the main menu, as shown below:

Published with written permission from SPSS Statistics, IBM Corporation.
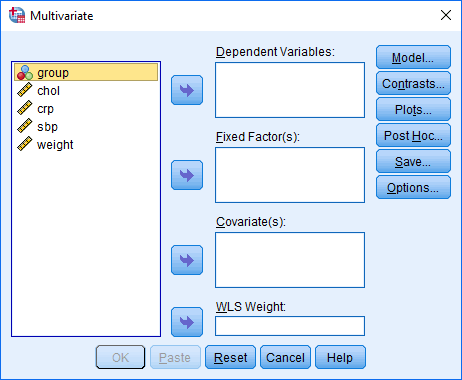
You will be presented with the Multivariate dialogue box, as shown below:
Published with written permission from SPSS Statistics, IBM Corporation.
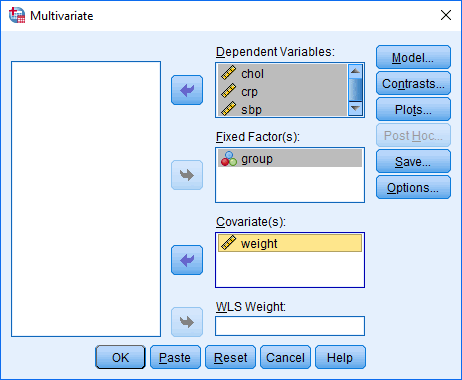
- Transfer the dependent variables, chol, crp and sbp, into the Dependent Variable: box, the independent variable, group, into the Fixed Factor(s): box, and the covariate variable, weight, into the Covariate(s): box using the relevant buttons. You will end up with a screen similar to the following:
Published with written permission from SPSS Statistics, IBM Corporation.
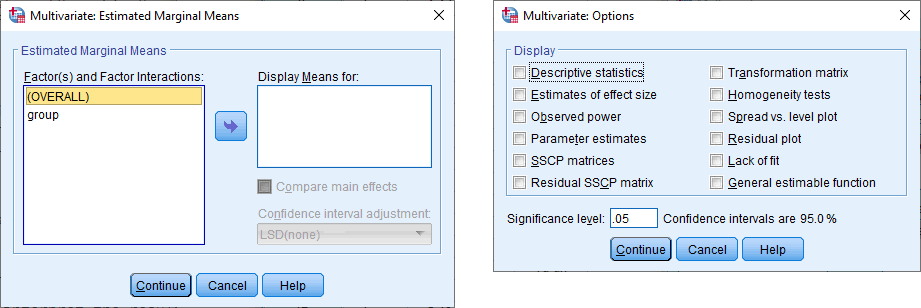
- If you have SPSS Statistics versions 25 to 30 (or the subscription version of SPSS Statistics, you can instruct SPSS Statistics to run a post hoc test to follow up a statistically significant one-way MANCOVA analysis using the Multivariate: Estimated Marginal Means and Multivariate: Options dialogue boxes. These can be accessed by clicking on the and buttons, which will launch the Multivariate: Estimated Marginal Means and Multivariate: Options dialogue boxes, as shown below:
Note: If you have SPSS Statistics version 24 or an earlier version of SPSS Statistics, see the Note below.
Published with written permission from SPSS Statistics, IBM Corporation.
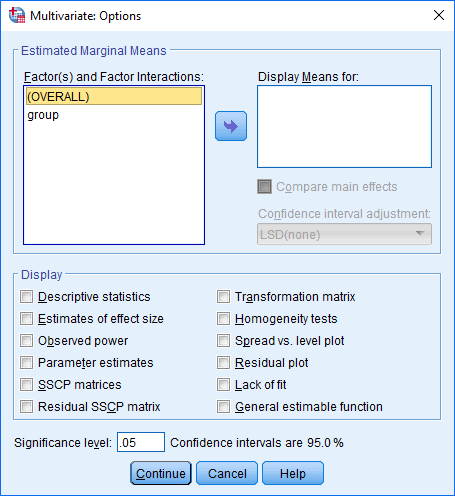
Note: If you have SPSS Statistics version 24 or an earlier version of SPSS Statistics, the options to run a post hoc test to follow up a statistically significant one-way MANCOVA analysis are accessed by clicking on the button, which will launch the Multivariate: Options dialogue box, as shown below:
In this "quick start" guide, we simply show you how to interpret the main one-way MANCOVA result and not the follow-up analyses. Therefore, you can move onto the next step below.
- Click on the button. This will return you to the Multivariate dialogue box.
- Click on the button to generate the results for the one-way MANCOVA.
SPSS Statistics
Interpreting the results of the one-way MANCOVA
SPSS Statistics produces a number of different tables in its one-way MANCOVA analysis, but you only need to interpret the Multivariate Tests table to determine whether your one-way MANCOVA is statistically significant. To reiterate, the analysis below assumes that your data has already met the 11 assumptions required for a one-way MANCOVA to give you a valid result.
SPSS Statistics
Multivariate Tests
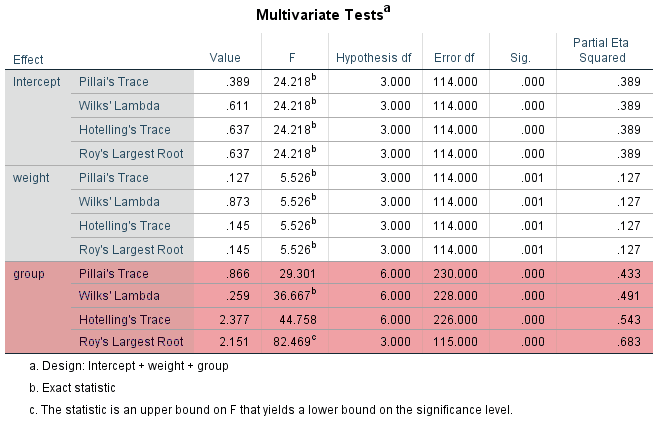
The main purpose of running a one-way MANCOVA is to establish whether the groups of the independent variable, group, are statistically significantly different on the dependent variables (i.e., chol, crp and sbp, collectively), after controlling for a covariate, weight. If the one-way MANCOVA is statistically significant, this suggests that there is a statistically significant adjusted mean difference between the groups of the independent variable in terms of the combined dependent variable (after adjusting for the continuous covariate). For example, it would suggest that the combined mean scores of our dependent variables – chol, crp and sbp – which have been adjusted for the continuous covariate, weight, differ between the three groups of our independent variable, group (i.e., the "Low", "Moderate" and "High" physical activity groups). Therefore, in order to interpret the results from the one-way MANCOVA, you need to look at the Multivariate Tests table, as highlighted below:
Published with written permission from SPSS Statistics, IBM Corporation.
Note: We have highlighted the rows within the group heading. This row heading will have the same name as your independent variable. In our example, it is labelled group because this is the name of our independent variable, group. Therefore, when you analyse your own data, look for the row heading in the Multivariate Tests table that matches the name of your independent variable.
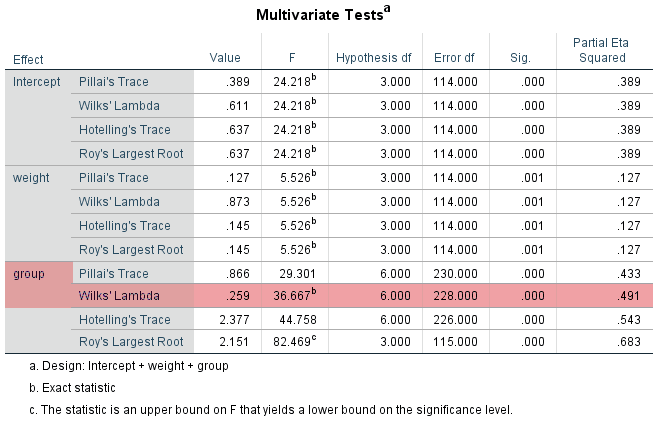
The different names given to each row – Pillai's Trace, Wilks' Lambda, Hotelling's Trace and Roy's Largest Root – are the names of the different multivariate statistics that can be used to test the statistical significance of the differences between groups. Each different calculation will provide you with the probability (p-value) of getting an F-statistic greater or equal to the one calculated. They will also provide you with an effect size. However, you have the added complication of having to decide which multivariate F-statistic to use, especially because they do not always provide the same answer. The most commonly recommended multivariate statistic to use is Wilks' Lambda (Λ) and this is what will be used in this example.
Therefore, the result for the one-way MANCOVA is found along the "Wilks' Lambda" row within the "group" row of the Multivariate Tests table, as highlighted below:
Published with written permission from SPSS Statistics, IBM Corporation.
Note: Notice that you are looking at the Wilks' Lambda row within the row heading, group. For the purpose of this analysis, you can also ignore all other rows, including the rows headed Intercept and weight. When you analyse your data, you will have an Intercept row heading, but since weight reflects the name of our continuous covariate, weight, this heading name will be different (i.e., it will have the same label as the name of your continuous covariate).
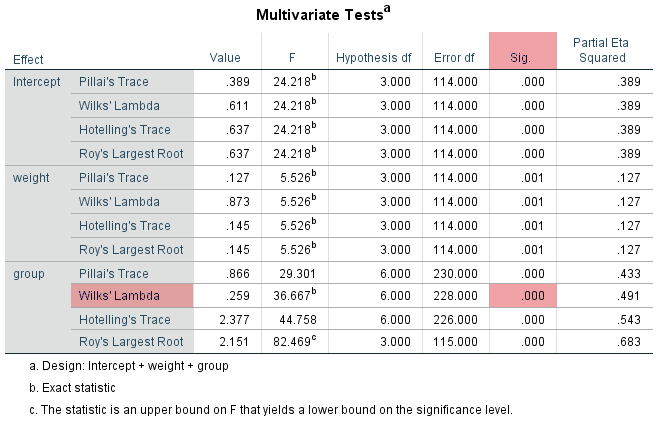
If the one-way MANCOVA is statistically significant, you will have a p-value (in the "Sig." column) less than .05 (i.e., p < .05). Alternatively, if p > .05 (i.e., if p is greater than .05), the one-way MANCOVA is not statistically significant. Therefore, in our example, if p < .05 there is a statistically significant difference between the physical activity groups in terms of the combined health variables, after controlling for weight. Alternatively, if p > .05 there is not a statistically significant difference between the physical activity groups in terms of the combined health variables, after controlling for weight. As such, you need to consult the "Sig." column along the Wilks' Lambda row, as highlighted below:
Published with written permission from SPSS Statistics, IBM Corporation.
You can see that the statistical significance value is .000 (i.e., the "Sig." column), which means that p < .0005. Since .000 (i.e., p < .0005) is less than .05 (i.e., p < .05), the one-way MANCOVA is statistically significant. That is, there are statistically significant differences in the combined health variables between physical activity levels, after controlling for weight.
SPSS Statistics will also report an effect size called partial eta squared (i.e., partial η2). This value was found in the "Partial Eta Squared" column of the Multivariate Tests table. At present, there are no agreed upon definitions of what constitutes a strong (or otherwise) effect size (Huberty & Olejnik, 2006).
SPSS Statistics
Reporting the results of the one-way MANCOVA
You could report a statistically significant one-way MANCOVA result as follows:
There was a statistically significant difference between the physical activity groups on the combined dependent variables after controlling for weight, F(6, 228) = 36.667, p < .0005, Wilks' Λ = .259, partial η2 = .491.
There was a statistically significant difference between the physical activity groups on the combined dependent variables after controlling for weight, F(6, 228) = 36.667, p < .001, Wilks' Λ = .259, partial η2 = .491.
In the statement above, the F(6, 228) = 36.667, p < .0005, Wilks' Λ = .259, partial η2 = .491 part has the following meaning:
| |
Column name |
Column meaning |
| |
F |
Indicates that we are comparing to an F-distribution (F-test). |
| |
6 in (6, 228) |
Indicates the degrees of freedom of Wilks' Lambda for the one-way MANCOVA. |
| |
228 in (6, 228) |
Indicates the degrees of freedom for the error term for Wilks' Lambda. |
| |
36.667 |
Indicates the obtained value of the F-statistic (obtained F-value) for Wilks' Lambda. |
| |
p < .0005 |
Indicates the probability of obtaining the observed F-value given the null hypothesis is true. |
| |
Wilks' Λ = .259 |
Indicates the value of Wilks' Lambda. |
| |
partial η2 = .491 |
A measure of effect size for Wilks' Lambda. |
Alternatively, if the one-way MANCOVA result was not statistically significant, you could report the result as follows:
There was no statistically significant difference between the physical activity groups on the combined dependent variables after controlling for weight, F(6, 228) = 1.589, p = .485, Wilks' Λ = .102, partial η2 = .061.
There was no statistically significant difference between the physical activity groups on the combined dependent variables after controlling for weight, F(6, 228) = 1.589, p = .485, Wilks' Λ = .102, partial η2 = .061.
Note: The values used for the statement above were made up to provide an example.
SPSS Statistics
Following-up a statistically significant one-way MANCOVA
How to follow up a statistically significant one-way MANCOVA result is controversial. One method that is recommended, which is also the default action of SPSS Statistics, is to follow up with univariate statistical tests (Pituch & Stevens, 2016). This involves two steps:
- STEP ONE: If the one-way MANCOVA is statistically significant, this suggests that there is a statistically significant adjusted mean difference between the groups of the independent variable in terms of the combined dependent variables (after adjusting for the continuous covariate). However, the one-way MANCOVA does not tell you whether there is also a statistically significant adjusted mean difference between the groups of the independent variable in terms of each dependent variable. This is the first follow-up test that you can perform.
- STEP TWO: If any of the follow-up analyses in STEP ONE is statistically significant, you can follow this up by examining all possible pairwise comparisons between the groups of your independent variable. This will indicate which of the groups of the independent variable are statistically significantly different in terms of the adjusted group means on the dependent variable (i.e., after adjusting for the continuous covariate). For example, these pairwise comparisons will explain whether each dependent variable, after adjusting for the covariate, was higher in one group (e.g., Group A) compared to another group (e.g., Group B), and whether this difference was statistically significant.
If the one-way MANCOVA is not statistically significant, you would normally not follow up the one-way MANCOVA with any further tests.