One-way ANCOVA in SPSS Statistics
Introduction
The one-way ANCOVA (analysis of covariance) can be thought of as an extension of the one-way ANOVA to incorporate a covariate. Like the one-way ANOVA, the one-way ANCOVA is used to determine whether there are any significant differences between two or more independent (unrelated) groups on a dependent variable. However, whereas the ANOVA looks for differences in the group means, the ANCOVA looks for differences in adjusted means (i.e., adjusted for the covariate). As such, compared to the one-way ANOVA, the one-way ANCOVA has the additional benefit of allowing you to "statistically control" for a third variable (sometimes known as a "confounding variable"), which you believe will affect your results. This third variable that could be confounding your results is called the covariate and you include it in your one-way ANCOVA analysis.
Note: You can have more than one covariate and although covariates are traditionally measured on a continuous scale, they can also be categorical. However, when the covariates are categorical, the analysis is not often called ANCOVA. In addition, the "one-way" part of one-way ANCOVA refers to the number of independent variables. If you have two independent variables rather than one, you could run a two-way ANCOVA.
If you are familiar with the one-way ANCOVA, you can skip to the Assumptions section. On the other hand, if you are not familiar with the one-way ANCOVA, the example below should help provide some clarity.
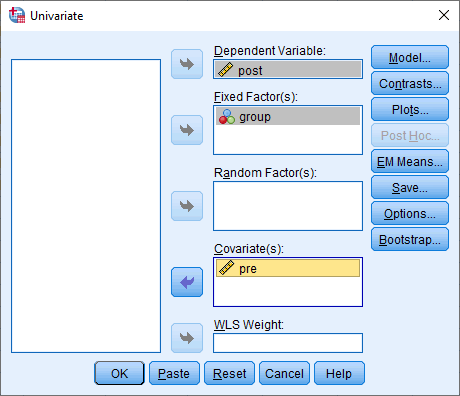
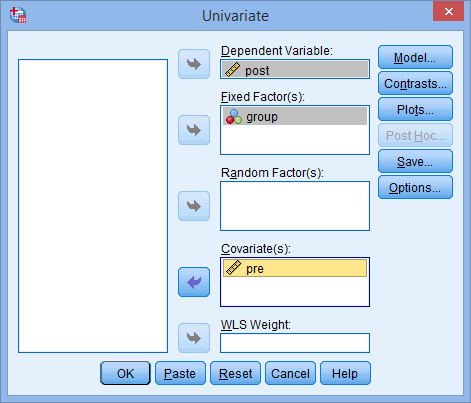
Researchers wanted to investigate the effect of three different types of exercise intervention on systolic blood pressure. To do this, they recruited 60 participants to their study. They randomly allocated 20 participants to each of three interventions: a "low-intensity exercise intervention", a "moderate-intensity exercise intervention" and a "high-intensity exercise intervention". The exercise in all interventions burned the same number of calories. Each participant had their "systolic blood pressure" measured before the intervention and immediately after the intervention. The researcher wanted to know if the different exercise interventions had different effects on systolic blood pressure. To answer this question, the researchers wanted to determine whether there were any differences in mean systolic blood pressure after the exercise interventions (i.e., whether post-intervention mean systolic blood pressure different between the different interventions). However, the researchers expected that the impact of the three different exercise interventions on mean systolic blood pressure would be affected by the participants' starting systolic blood pressure (i.e., their systolic blood pressure before the interventions). To control the post-intervention systolic blood pressure for the differences in pre-intervention systolic blood pressure, you can run a one-way ANCOVA with pre-intervention systolic blood pressure as the covariate, intervention as the independent variable and post-intervention systolic blood pressure as the dependent variable. If you find a statistically significant difference between interventions, you can follow up a one-way ANCOVA with a post hoc test to determine which specific exercise interventions differed in terms of their effect on systolic blood pressure (e.g., whether the high-intensity exercise intervention had a greater effect on systolic blood pressure than the low-intensity exercise intervention).
This "quick start" guide shows you how to carry out a one-way ANCOVA (with one covariate) using SPSS Statistics, as well as interpret and report the results from this test. Since the one-way ANCOVA is often followed up with a post hoc test, we also show you how to carry out a post hoc test using SPSS Statistics. However, before we introduce you to this procedure, you need to understand the different assumptions that your data must meet in order for a one-way ANCOVA to give you a valid result. We discuss these assumptions next.
SPSS Statistics
Basic requirements and assumptions of a one-way ANCOVA
When you choose to analyse your data using a one-way ANCOVA, part of the process involves checking to make sure that the data you want to analyse can actually be analysed using a one-way ANCOVA. You need to do this because it is only appropriate to use a one-way ANCOVA if your data "passes" nine assumptions that are required for a one-way ANCOVA to give you a valid result. In practice, checking for these nine assumptions just adds a little bit more time to your analysis, requiring you to click a few more buttons in SPSS Statistics when performing your analysis, as well as think a little bit more about your data, but it is not a difficult task.
Before we introduce you to these nine assumptions, do not be surprised if, when analysing your own data using SPSS Statistics, one or more of these assumptions is violated (i.e., is not met). This is not uncommon when working with real-world data rather than textbook examples, which often only show you how to carry out a one-way ANCOVA when everything goes well! However, don’t worry. Even when your data fails certain assumptions, there is often a solution to overcome this. First, let’s take a look at these nine assumptions:
- Assumption #1: Your dependent variable and covariate variable(s) should be measured on a continuous scale (i.e., they are measured at the interval or ratio level). Examples of variables that meet this criterion include revision time (measured in hours), intelligence (measured using IQ score), exam performance (measured from 0 to 100), weight (measured in kg), and so forth. You can learn more about continuous variables in our article: Types of Variable. As stated earlier, you can have categorical covariates (e.g., a categorical variables such as "gender", which has two categories: "males" and "females"), but the analysis is not usually referred to as an ANCOVA in this situation.
- Assumption #2: Your independent variable should consist of two or more categorical, independent groups. Example independent variables that meet this criterion include gender (e.g., two groups: male and female), ethnicity (e.g., three groups: Caucasian, African American and Hispanic), physical activity level (e.g., four groups: sedentary, low, moderate and high), profession (e.g., five groups: surgeon, doctor, nurse, dentist, therapist), and so forth.
- Assumption #3: You should have independence of observations, which means that there is no relationship between the observations in each group or between the groups themselves. For example, there must be different participants in each group with no participant being in more than one group. This is more of a study design issue than something you can test for, but it is an important assumption of a one-way ANCOVA. If your study fails this assumption, you will need to use another statistical test instead of a one-way ANCOVA (e.g., a repeated measures design). If you are unsure whether your study meets this assumption, you can use our Statistical Test Selector, which is part of our enhanced guides.
- Assumption #4: There should be no significant outliers. Outliers are simply data points within your data that do not follow the usual pattern (e.g., in a study of 100 students' IQ scores, where the mean score was 108 with only a small variation between students, one student had a score of 156, which is very unusual, and may even put her in the top 1% of IQ scores globally). The problem with outliers is that they can have a negative effect on the one-way ANCOVA, reducing the validity of your results. Fortunately, when using SPSS Statistics to run a one-way ANCOVA on your data, you can easily detect possible outliers. In our enhanced one-way ANCOVA guide, we: (a) show you how to detect outliers using SPSS Statistics; and (b) discuss some of the options you have in order to deal with outliers. You can learn more about our enhanced content on our Features: Overview page.
- Assumption #5: Your residuals should be approximately normally distributed for each category of the independent variable. We talk about the ANCOVA only requiring approximately normal residuals because it is quite "robust" to violations of normality, meaning that the assumption can be violated to a degree and still provide valid results. You can test for normality using two Shapiro-Wilk tests of normality: one to test the within-group residuals and one to test the overall model fit. Both of these are easily tested for using SPSS Statistics. In addition to showing you how to carry out these tests in our enhanced one-way ANCOVA guide, we also explain what you can do if your data fails this assumption (i.e., if it fails it by more than a little bit).
- Assumption #6: There needs to be homogeneity of variances. You can test this assumption in SPSS Statistics using Levene's test for homogeneity of variances. In our enhanced one-way ANCOVA guide, we (a) show you how to perform Levene’s test for homogeneity of variances in SPSS Statistics, (b) explain some of the things you will need to consider when interpreting your data, and (c) present possible ways to continue with your analysis if your data fails to meet this assumption.
- Assumption #7: The covariate should be linearly related to the dependent variable at each level of the independent variable. You can test this assumption in SPSS Statistics by plotting a grouped scatterplot of the covariate, post-test scores of the dependent variable and independent variable. In our enhanced one-way ANCOVA guide, we show you how to (a) produce this grouped scatterplot in SPSS Statistics, (b) interpret the grouped scatterplot, and (c) present possible ways to continue with your analysis if your data fails to meet this assumption.
- Assumption #8: There needs to be homoscedasticity. You can test this assumption in SPSS Statistics by plotting a scatterplot of the standardized residuals against the predicted values. In our enhanced one-way ANCOVA guide, we (a) show you how to produce a scatterplot in SPSS Statistics to test for homoscedasticity, (b) explain some of the things you will need to consider when interpreting your data, and (c) present possible ways to continue with your analysis if your data fails to meet this assumption.
- Assumption #9: There needs to be homogeneity of regression slopes, which means that there is no interaction between the covariate and the independent variable. By default, SPSS Statistics does not include an interaction term between a covariate and an independent in its GLM procedure so that you can test this. Therefore, in our enhanced one-way ANCOVA guide, we (a) show you how to test for homogeneity of regression slopes separately from the main one-way ANCOVA procedure using SPSS Statistics, (b) interpret the output SPSS Statistics produces, and (c) explain the implications of meeting or violating this assumption.
You can check assumptions #4, #5, #6, #7, #8 and #9 using SPSS Statistics. Before doing this, you should make sure that your data meets assumptions #1, #2 and #3, although you don't need SPSS Statistics to do this. Remember that if you do not run the statistical tests on these assumptions correctly, the results you get when running a one-way ANCOVA might not be valid. This is why we dedicate a number of sections of our enhanced one-way ANCOVA guide to help you get this right. You can find out about our enhanced content on our Features: Overview page, or more specifically, learn how we help with testing assumptions on our Features: Assumptions page.
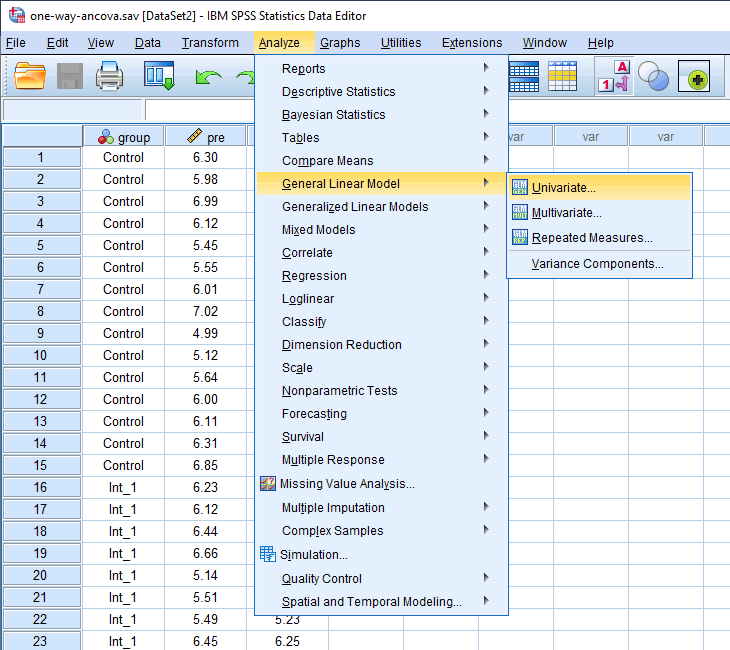
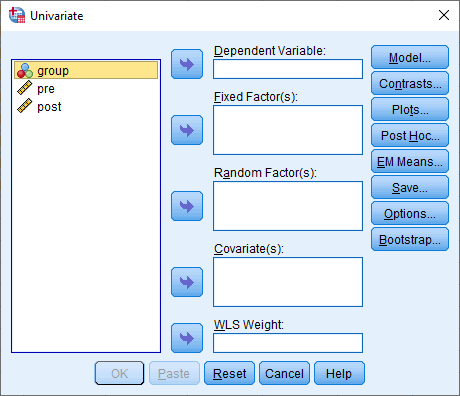
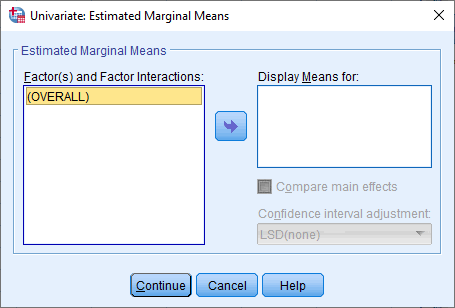
In the section, Test Procedure in SPSS Statistics, we illustrate the SPSS Statistics procedure to perform a one-way ANCOVA, assuming that no assumptions have been violated. First, we set out the example we use to explain the one-way ANCOVA procedure in SPSS Statistics.