One-way ANCOVA in SPSS Statistics (cont...)
Interpreting the SPSS Statistics output of a one-way ANCOVA
SPSS Statistics generates quite a few tables in its one-way ANCOVA analysis. In this section, we show you only the main tables required to understand your results from the one-way ANCOVA and the post hoc test. For a complete explanation of the output you have to interpret when checking your data for the nine assumptions required to carry out a one-way ANCOVA, see our enhanced guide. This includes relevant scatterplots and grouped scatterplot, and output from your Shapiro-Wilk test for normality, Levene's test for homogeneity of variances, and tests of between-subjects effects. You can learn more about our enhanced content on our Features: Overview page.
In this "quick start" guide, we explain the descriptives table, as well as the results for the one-way ANCOVA and post hoc test. We go through each table in turn:
SPSS Statistics
Descriptive statistics
The Descriptive Statistics table (shown below) presents descriptive statistics (mean, standard deviation, number of participants) on the dependent variable, post, for the different levels of the independent variable, group. These values do not include any adjustments made by the use of a covariate in the analysis.
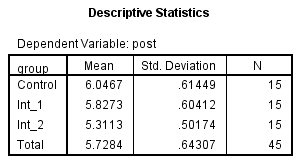
Published with written permission from SPSS Statistics, IBM Corporation.
SPSS Statistics
One-way ANCOVA results
The main section of the results is presented in the Tests of Between-Subjects Effects table, as shown below:
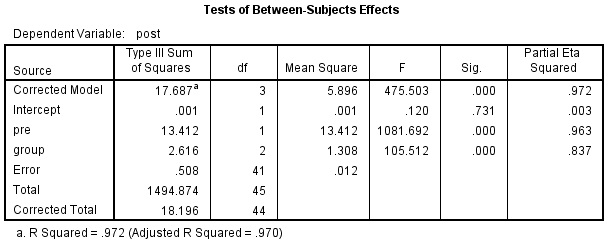
Published with written permission from SPSS Statistics, IBM Corporation.
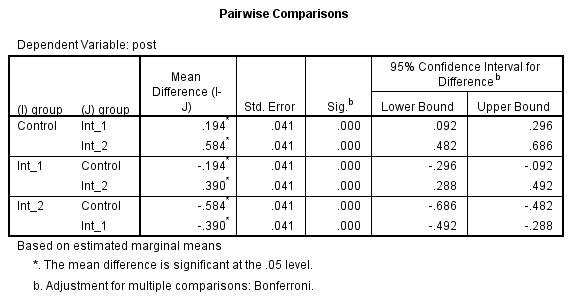
This table informs you whether the different interventions were statistically significantly different having adjusted for your covariate. Put another way, whether there was an overall statistically significant difference in post-intervention cholesterol concentration (post) between the different interventions (group) once their means had been adjusted for pre-intervention cholesterol concentrations (pre). This is highlighted below:
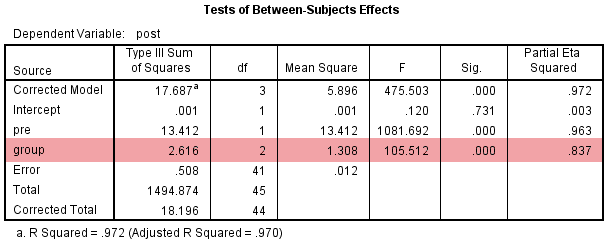
Published with written permission from SPSS Statistics, IBM Corporation.
In order to interpret the results, read along the group row until you reach the "Sig." column. This provides the statistical significance value (i.e., p-value) of whether there are statistically significant differences in post-intervention systolic blood pressure (i.e., the dependent variable) between the groups (i.e., the independent variable) when adjusted for pre-intervention systolic blood pressure (i.e., the covariate). In this example, you can see that there is a statistically significant difference between adjusted means (p < .0005).
SPSS Statistics
Estimates
To get a better understanding of how the covariate has adjusted the original post group means, you can consult the Estimates table, as shown below:
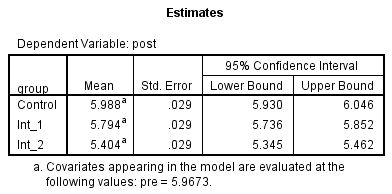
Published with written permission from SPSS Statistics, IBM Corporation.
Notice how the mean values have changed compared to those found in the Descriptive Statistics table above. These new values represent the adjusted means (i.e., the original means adjusted for the covariate).