One-way MANOVA in SPSS Statistics (cont...)
Interpreting the SPSS Statistics output of the one-way MANOVA
SPSS Statistics produces many different tables in its one-way MANOVA analysis. In this section, we show you only the main tables required to understand your results from the one-way MANOVA and Tukey post-hoc tests. For a complete explanation of the output you have to interpret when checking your data for the nine assumptions required to carry out a one-way MANOVA, see our enhanced one-way MANOVA guide. This includes relevant boxplots, scatterplot matrix and Pearson's correlation coefficients, and output from your Mahalanobis distance test, Shapiro-Wilk test for normality, and Box's M test of equality of covariance, and if required, Levene's test of homogeneity of variance.
However, in this "quick start" guide, we focus only on the four main tables you need to understand your one-way MANOVA results, assuming that your data has already met the nine assumptions required for a one-way MANOVA to give you a valid result.
SPSS Statistics
Descriptive Statistics
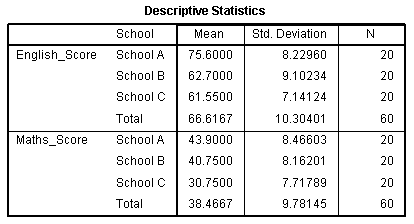
The first important one is the Descriptive Statistics table shown below. This table is very useful as it provides the mean and standard deviation for the two different dependent variables, which have been split by the independent variable. In addition, the table provides "Total" rows, which allows means and standard deviations for groups only split by the dependent variable to be known.

Published with written permission from SPSS Statistics, IBM Corporation.
SPSS Statistics
Multivariate Tests
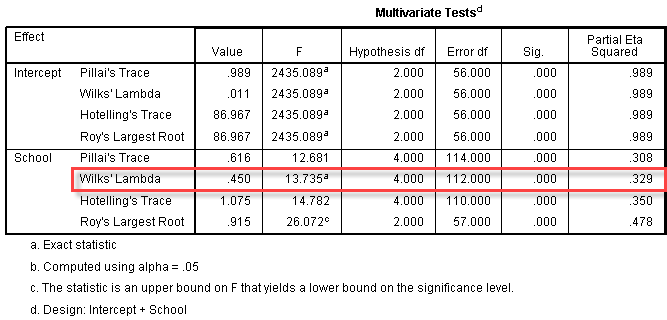
The Multivariate Tests table is where we find the actual result of the one-way MANOVA. You need to look at the second Effect, labelled "School", and the Wilks' Lambda row (highlighted in red). To determine whether the one-way MANOVA was statistically significant you need to look at the "Sig." column. We can see from the table that we have a "Sig." value of .000, which means p < .0005. Therefore, we can conclude that this school's pupils academic performance was significantly dependent on which prior school they had attended (p < .0005).
Published with written permission from SPSS Statistics, IBM Corporation.
SPSS Statistics
Reporting the results of the one-way MANOVA (without follow-up tests)
You could report the result of this test as follows:
There was a statistically significant difference in academic performance based on a pupil's prior school , F (4, 112) = 13.74, p < .0005; Wilk's Λ = 0.450, partial η2 = .33.
If you had not achieved a statistically significant result, you would not perform any further follow-up tests. However, as our case shows that we did, we will continue with further tests.
SPSS Statistics
Univariate ANOVAs
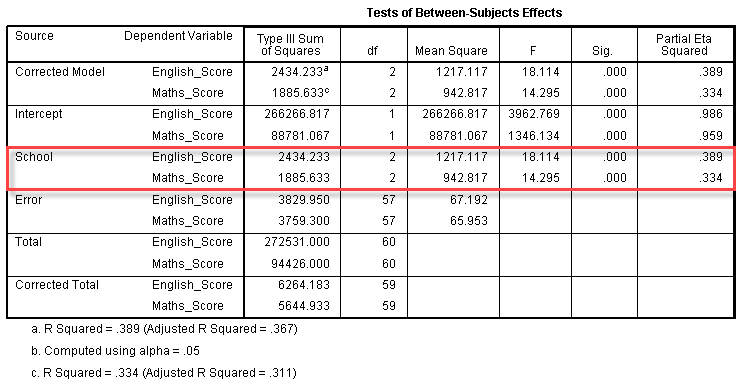
To determine how the dependent variables differ for the independent variable, we need to look at the Tests of Between-Subjects Effects table (highlighted in red):
Published with written permission from SPSS Statistics, IBM Corporation.
We can see from this table that prior schooling has a statistically significant effect on both English (F (2, 57) = 18.11; p < .0005; partial η2 = .39) and Maths scores (F (2, 57) = 14.30; p < .0005; partial η2 = .33). It is important to note that you should make an alpha correction to account for multiple ANOVAs being run, such as a Bonferroni correction. As such, in this case, we accept statistical significance at p < .025.
SPSS Statistics
Multiple Comparisons
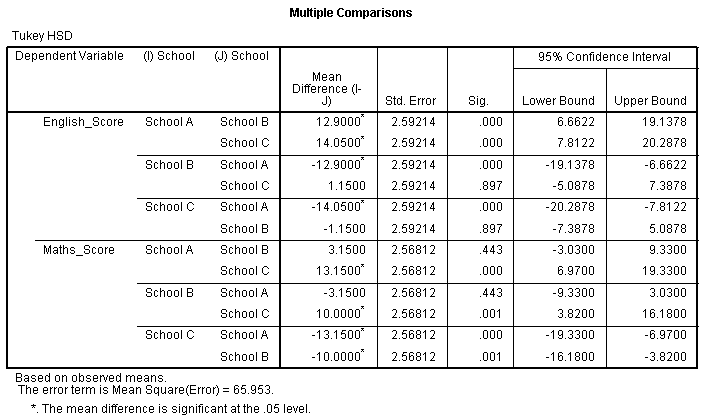
We can follow up these significant ANOVAs with Tukey's HSD post-hoc tests, as shown below in the Multiple Comparisons table:
Published with written permission from SPSS Statistics, IBM Corporation.
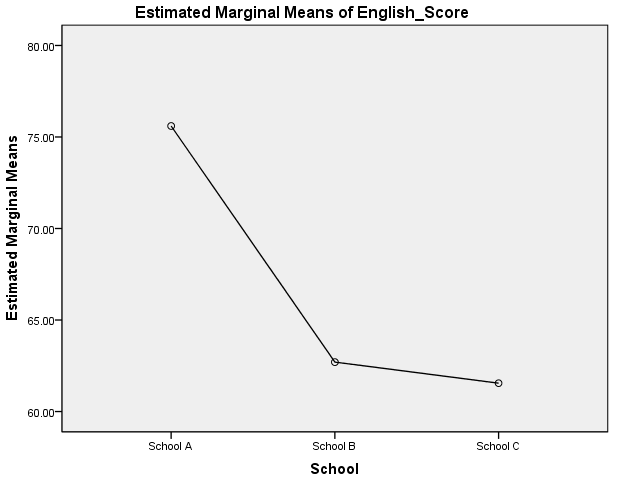
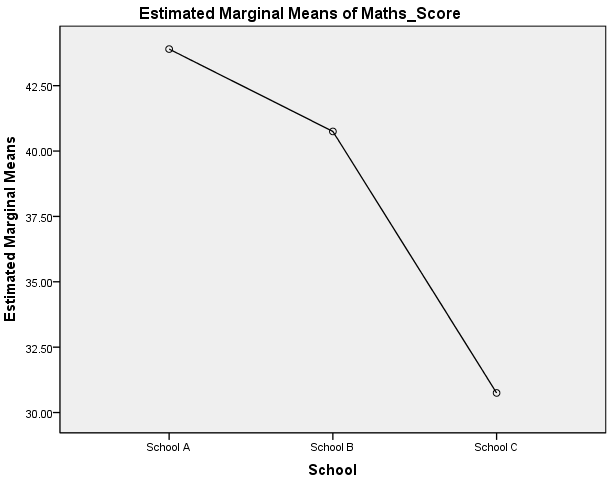
The table above shows that for mean scores for English were statistically significantly different between School A and School B (p < .0005), and School A and School C (p < .0005), but not between School B and School C (p = .897). Mean maths scores were statistically significantly different between School A and School C (p < .0005), and School B and School C (p = .001), but not between School A and School B (p = .443). These differences can be easily visualised by the plots generated by this procedure, as shown below:
Published with written permission from SPSS Statistics, IBM Corporation.
Published with written permission from SPSS Statistics, IBM Corporation
In our enhanced one-way MANOVA guide, we show you how to write up the results from your assumptions tests, one-way MANOVA and Tukey post-hoc results if you need to report this in a dissertation/thesis, assignment or research report. We do this using the Harvard and APA styles. You can learn more about our enhanced content on our Features: Overview page.