Pearson's Product-Moment Correlation using SPSS Statistics
Introduction
The Pearson product-moment correlation coefficient (Pearson’s correlation, for short) is a measure of the strength and direction of association that exists between two variables measured on at least an interval scale.
For example, you could use a Pearson’s correlation to understand whether there is an association between exam performance and time spent revising. You could also use a Pearson's correlation to understand whether there is an association between depression and length of unemployment.
A Pearson’s correlation attempts to draw a line of best fit through the data of two variables, and the Pearson correlation coefficient, r, indicates how far away all these data points are from this line of best fit (i.e., how well the data points fit this model/line of best fit). You can learn more in our more general guide on Pearson's correlation, which we recommend if you are not familiar with this test.
Note: If one of your two variables is dichotomous you can use a point-biserial correlation instead, or if you have one or more control variables, you can run a Pearson's partial correlation.
This "quick start" guide shows you how to carry out a Pearson's correlation using SPSS Statistics, as well as interpret and report the results from this test. However, before we introduce you to this procedure, you need to understand the different assumptions that your data must meet in order for a Pearson's correlation to give you a valid result. We discuss these assumptions next.
SPSS Statistics
Assumptions
When you choose to analyse your data using Pearson’s correlation, part of the process involves checking to make sure that the data you want to analyse can actually be analysed using Pearson’s correlation. You need to do this because it is only appropriate to use Pearson’s correlation if your data "passes" four assumptions that are required for Pearson’s correlation to give you a valid result. In practice, checking for these four assumptions just adds a little bit more time to your analysis, requiring you to click of few more buttons in SPSS Statistics when performing your analysis, as well as think a little bit more about your data, but it is not a difficult task.
Before we introduce you to these four assumptions, do not be surprised if, when analysing your own data using SPSS Statistics, one or more of these assumptions is violated (i.e., is not met). This is not uncommon when working with real-world data rather than textbook examples, which often only show you how to carry out Pearson’s correlation when everything goes well! However, don’t worry. Even when your data fails certain assumptions, there is often a solution to overcome this. First, let’s take a look at these four assumptions:
- Assumption #1: Your two variables should be measured at the interval or ratio level (i.e., they are continuous). Examples of variables that meet this criterion include revision time (measured in hours), intelligence (measured using IQ score), exam performance (measured from 0 to 100), weight (measured in kg), and so forth. You can learn more about interval and ratio variables in our Types of Variable guide.
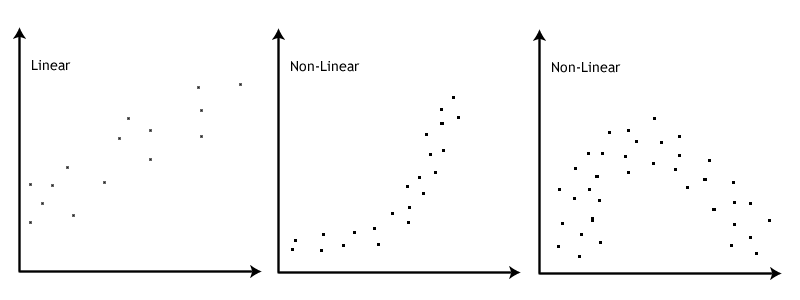
- Assumption #2: There is a linear relationship between your two variables. Whilst there are a number of ways to check whether a linear relationship exists between your two variables, we suggest creating a scatterplot using SPSS Statistics, where you can plot the one variable against the other variable, and then visually inspect the scatterplot to check for linearity. Your scatterplot may look something like one of the following:

If the relationship displayed in your scatterplot is not linear, you will have to either run a nonparametric equivalent to Pearson’s correlation or transform your data, which you can do using SPSS Statistics. In our enhanced guides, we show you how to: (a) create a scatterplot to check for linearity when carrying out Pearson’s correlation using SPSS Statistics; (b) interpret different scatterplot results; and (c) transform your data using SPSS Statistics if there is not a linear relationship between your two variables.
Note: Pearson's correlation determines the degree to which a relationship is linear. Put another way, it determines whether there is a linear component of association between two continuous variables. As such, linearity is not actually an assumption of Pearson's correlation. However, you would not normally want to pursue a Pearson's correlation to determine the strength and direction of a linear relationship when you already know the relationship between your two variables is not linear. Instead, the relationship between your two variables might be better described by another statistical measure. For this reason, it is not uncommon to view the relationship between your two variables in a scatterplot to see if running a Pearson's correlation is the best choice as a measure of association or whether another measure would be better.
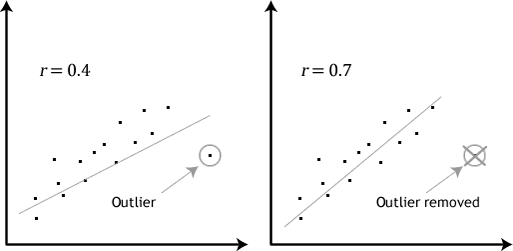
- Assumption #3: There should be no significant outliers. Outliers are simply single data points within your data that do not follow the usual pattern (e.g., in a study of 100 students’ IQ scores, where the mean score was 108 with only a small variation between students, one student had a score of 156, which is very unusual, and may even put her in the top 1% of IQ scores globally). The following scatterplots highlight the potential impact of outliers:
Pearson’s correlation coefficient, r, is sensitive to outliers, which can have a very large effect on the line of best fit and the Pearson correlation coefficient. Therefore, in some cases, including outliers in your analysis can lead to misleading results. Therefore, it is best if there are no outliers or they are kept to a minimum. Fortunately, when using SPSS Statistics to run Pearson’s correlation on your data, you can easily include procedures to screen for outliers. In our enhanced Pearson’s correlation guide, we: (a) show you how to detect outliers using a scatterplot, which is a simple process when using SPSS Statistics; and (b) discuss some of the options available to you in order to deal with outliers. - Assumption #4: Your variables should be approximately normally distributed. In order to assess the statistical significance of the Pearson correlation, you need to have bivariate normality, but this assumption is difficult to assess, so a simpler method is more commonly used. This simpler method involves determining the normality of each variable separately. To test for normality you can use the Shapiro-Wilk test of normality, which is easily tested for using SPSS Statistics. In addition to showing you how to do this in our enhanced Pearson’s correlation guide, we also explain what you can do if your data fails this assumption.
You can check assumptions #2, #3 and #4 using SPSS Statistics. Remember that if you do not test these assumptions correctly, the results you get when running a Pearson's correlation might not be valid. This is why we dedicate a number of sections of our enhanced Pearson's correlation guide to help you get this right. You can find out about our enhanced content on our Features: Overview page, or more specifically, learn how we help with testing assumptions on our Features: Assumptions page.
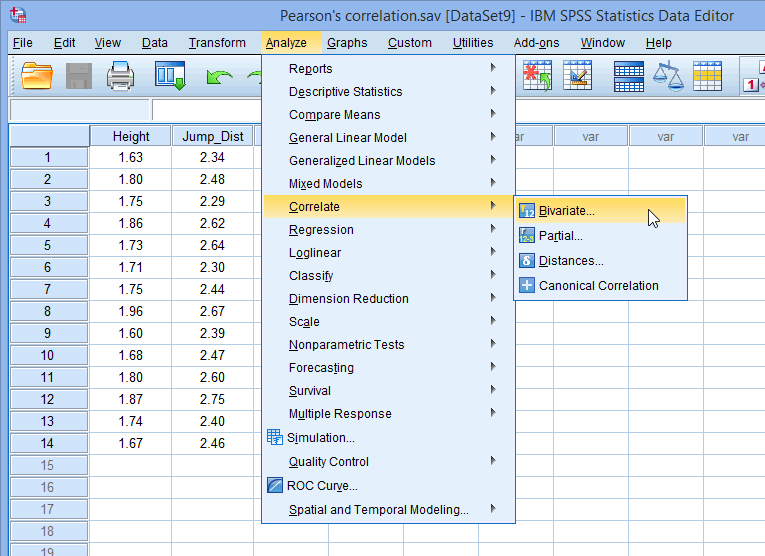
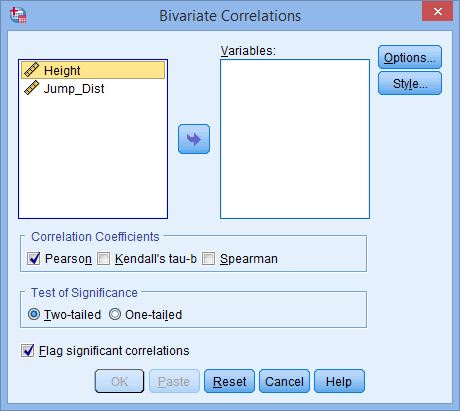
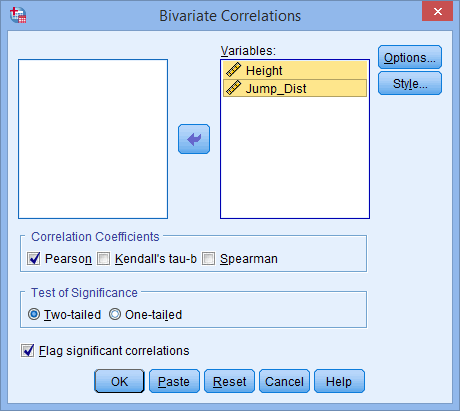
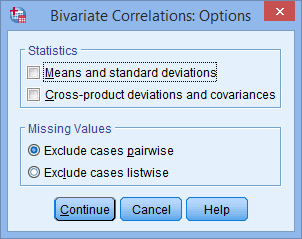
In the section, Test Procedure in SPSS Statistics, we illustrate the SPSS Statistics procedure to perform a Pearson’s correlation assuming that no assumptions have been violated. First, we set out the example we use to explain the Pearson’s correlation procedure in SPSS Statistics.