Login

Partial Correlation using SPSS Statistics

Introduction

Partial correlation is a measure of the strength and direction of a linear relationship between two continuous variables whilst controlling for the effect of one or more other continuous variables (also known as 'covariates' or 'control' variables). Although partial correlation does not make the distinction between independent and dependent variables, the two variables are often considered in such a manner (i.e., you have one continuous dependent variable and one continuous independent variable, as well as one or more continuous control variables).

Note: Many aspects of partial correlation can be dealt with using multiple regression and it is sometimes recommended that this is how you approach your analysis. This is somewhat evident in the SPSS Statistics where you can carry out partial correlation using two different procedures: Correlate and Regression.

For example, you could use partial correlation to understand whether there is a linear relationship between 10,000 m running performance and VO2max (a marker of aerobic fitness), whilst controlling for wind speed and relative humidity (i.e., the continuous dependent variable would be "10,000 m running performance", measured in minutes and seconds, the continuous independent variable would be VO2max, which is measured in ml/min/kg, and the two control variables – that is, the two other continuous independent variables you are adjusting for – would be "wind speed", measured in mph, and "relative humidity", expressed as a percentage). You may believe that there is a relationship between 10,000 m running performance and VO2max (i.e., the larger an athlete's VO2max, the better their running performance), but you would like to know if this relationship is affected by wind speed and humidity (e.g., if the relationship changes when taking wind speed and humidity into account since you suspect that athletes' performance decreases in more windy and humid conditions). Alternately, you could use partial correlation to understand whether there is a linear relationship between ice cream sales and price, whilst controlling for daily temperature (i.e., the continuous dependent variable would be "ice cream sales", measured in US dollars, the continuous independent variable would be "price", also measured in US dollars, and the single control variable – that is, the single continuous independent variable you are adjusting for – would be daily temperature, measured in °C). You may believe that there is a relationship between ice cream sales and prices (i.e., sales go down as price goes up), but you would like to know if this relationship is affected by daily temperature (e.g., if the relationship changes when taking into account daily temperature since you suspect customers are more willing to buy ice creams, irrespective of price, when it is a really nice, hot day).

This "quick start" guide shows you how to carry out a partial correlation using SPSS Statistics, as well as interpret and report the results from this test. However, before we introduce you to this procedure, you need to understand the different assumptions that your data must meet in order for a partial correlation to give you a valid result. We discuss these assumptions next.

SPSS Statistics

Assumptions of a partial correlation

When you choose to analyse your data using partial correlation, part of the process involves checking to make sure that the data you want to analyse can actually be analysed using partial correlation. You need to do this because it is only appropriate to use a partial correlation if your data "passes" five assumptions that are required for a partial correlation to give you a valid result. In practice, checking for these five assumptions just adds a little bit more time to your analysis, requiring you to click a few more buttons in SPSS Statistics when performing your analysis, as well as think a little bit more about your data, but it is not a difficult task.

Before we introduce you to these five assumptions, do not be surprised if, when analysing your own data using SPSS Statistics, one or more of these assumptions is violated (i.e., is not met). This is not uncommon when working with real-world data rather than textbook examples, which often only show you how to carry out a partial correlation when everything goes well! However, don’t worry. Even when your data fails certain assumptions, there is often a solution to overcome this. First, let’s take a look at these five assumptions:

You can check assumptions #3, #4 and #5 using SPSS Statistics. Remember that if you do not run the statistical tests on these assumptions correctly, the results you get when running a partial correlation might not be valid.

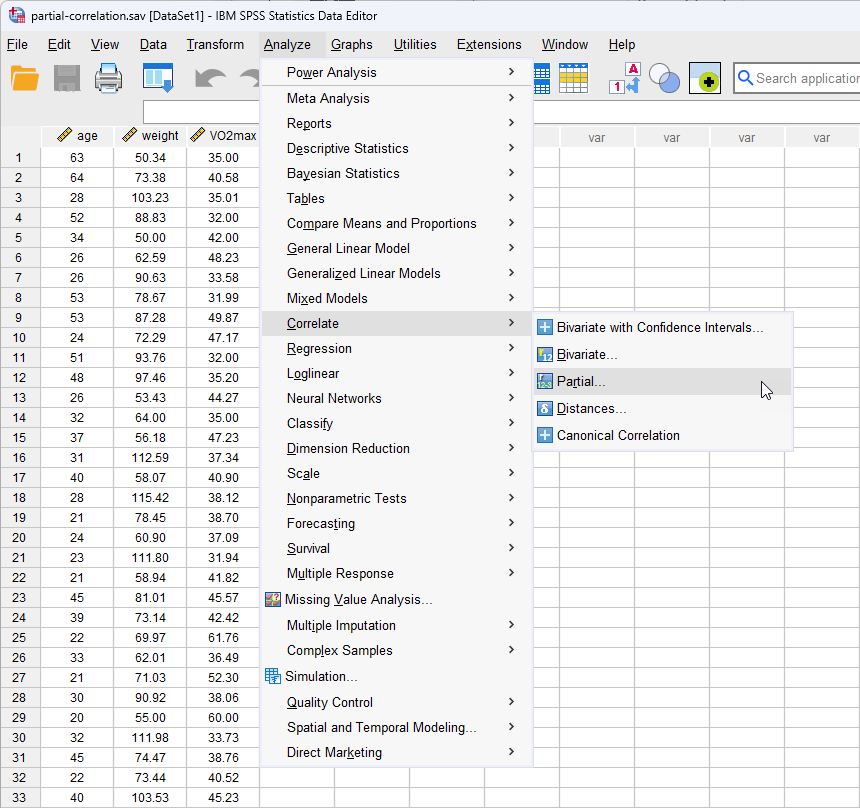
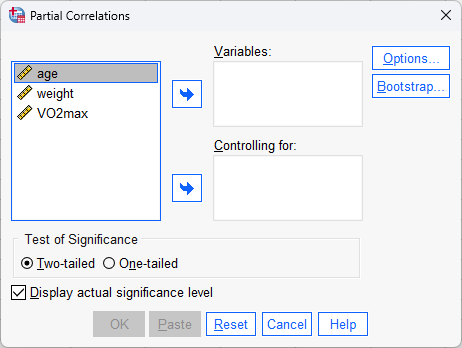
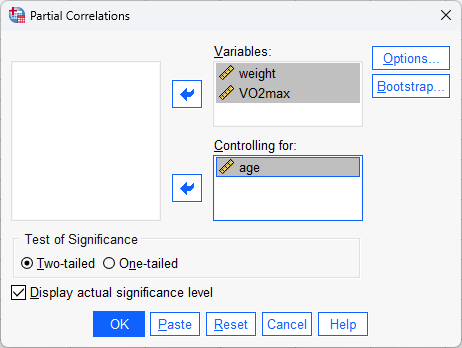
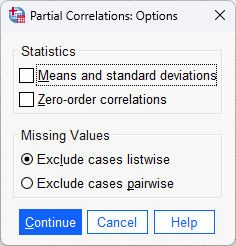
In the section, SPSS Statistics procedure, we illustrate the SPSS Statistics procedure to perform a partial correlation assuming that no assumptions have been violated. First, we set out the example we use to explain the partial correlation procedure in SPSS Statistics.

Testimonials
TAKE THE TOUR


SPSS Statistics

Example used in this guide & data setup in SPSS Statistics

A researcher wants to know whether there is a statistically significant linear relationship between VO2max (a marker of aerobic fitness) and a person's weight. Furthermore, the researcher wants to know whether this relationship remains after accounting for a person's age (i.e., if the relationship is influenced by a person's age). Therefore, the researcher uses partial correlation to determine whether there is a linear relationship between VO2max and weight, whilst controlling for age (i.e., the continuous dependent variable is "VO2max", measured in ml/min/kg, the continuous independent variable is "weight", measured in kg, and the control variable – that is, the additional continuous independent variable the researcher is adjusting for – is "age", measured in years).

In SPSS Statistics, three variables were created so that the data could be entered: VO2max (i.e., the person's VO2max, measured in ml/min/kg), weight (i.e., the person's weight, measured in kg) and age (i.e., the person's age, measured in years).

Note: This is a simple example of partial correlation with a single continuous control variable, but you can include multiple control variables in your analysis.

SPSS Statistics

SPSS Statistics procedure to carry out a partial correlation

The 6-step Correlate > Partial procedure below shows you how to analyse your data using a partial correlation in SPSS Statistics when none of the five assumptions in the previous section, Assumptions, have been violated. At the end of these six steps, we show you how to interpret the results from this test.

Note: In this example we show you how to use the Correlate procedure in SPSS Statistics, which is very straightforward, but it is also possible to use the Regression procedure, which has a number of advantages. For the purposes of a simple example like the one used in this "quick start" guide, we will use the Correlate procedure.

  1. Click Analyze > Correlate > Partial... on the menu system, as shown below:

    Note: The procedure that follows is identical for SPSS Statistics versions 18 to 29, as well as the subscription version of SPSS Statistics, with version 29 and the subscription version being the latest versions of SPSS Statistics. However, in version 27 and the subscription version, SPSS Statistics introduced a new look to their interface called "SPSS Light", replacing the previous look for version 26 and earlier versions, which was called "SPSS Standard". Therefore, if you have SPSS Statistics version 26 or an earlier version of SPSS Statistics, the images that follow will be blue rather than light grey. However, the procedure is identical.

    Menu for a partial correlation in SPSS Statistics

    Published with written permission from SPSS Statistics, IBM Corporation.


    You will be presented with the Partial Correlations dialogue box, as shown below:
    'Partial Correlations' dialogue box for a partial correlation in SPSS Statistics. Variables 'age', 'weight' & 'VO2max' on the left

    Published with written permission from SPSS Statistics, IBM Corporation.

  2. Transfer the variables weight and VO2max into the Variables: box, and age into the Controlling for: box, by dragging-and-dropping or by clicking the relevant Right arrow buttons. You will end up with a screen similar to the one below:
    'Partial Correlations' dialogue box SPSS. 'weight' & 'VO2max' transferred to 'Variables' box, 'age' to 'Controlling for' box

    Published with written permission from SPSS Statistics, IBM Corporation.

  3. Click on the Options button. You will be presented with the following Partial Correlations: Options screen:
    'Partial Correlations: Options' dialogue box for a partial correlation in SPSS. 'Exclude cases listwise' selected by default

    Published with written permission from SPSS Statistics, IBM Corporation.

  4. Tick the Means and standard deviations and Zero-order correlations checkbox in the –Statistics– area, as shown below:
    'Partial Correlations: Options' dialogue box in SPSS. 'Mean and standard deviations' & 'Zero-order correlations' selected

    Published with written permission from SPSS Statistics, IBM Corporation.

  5. Click on the Continue button. You will be returned to the Partial Correlations dialogue box, as shown below:
    'Partial Correlations' dialogue box for a partial correlation in SPSS Statistics. All options selected.

    Published with written permission from SPSS Statistics, IBM Corporation.

  6. Click on the OK button. This will generate the results.
Join the 10,000s of students, academics and professionals who rely on Laerd Statistics.TAKE THE TOUR
SPSS Statistics

Interpreting the results of a partial correlation

SPSS Statistics generates two tables for a partial correlation based on the procedure you ran in the previous section. These results will be correct if your data passed all the necessary assumptions of partial correlation, which we explained earlier in the Assumptions section. However, in this "quick start" guide, we focus on the results from the partial correlation procedure only, assuming that your data met all the relevant assumptions. You will be presented with the Descriptive Statistics and Correlations tables in the IBM SPSS Statistics Viewer window. We suggest starting with the Descriptive Statistics table to get a 'feel' for your data, as shown below:

'Descriptive Statistics' table for a partial correlation in SPSS. Shows 'Mean', 'Std. Deviation' & 'N' for each variable

Published with written permission from SPSS Statistics, IBM Corporation.

The descriptive statistics show that we had no missing data since the recorded sample size, N = 100, is the same as the number of participants that took part in the study. We can also see that the mean value of the dependent variable, VO2max, was 43.63 ml/min/kg (with a standard deviation of 8.57 ml/min/kg), whilst the mean weight of participants was 79.7 kg (with a standard deviation of 15.1 kg), and finally, the mean age of participants was 31.1 years (with a standard deviation of 9.1 years). This suggests that the sample of participants was slightly on the younger side rather than representing the population as a whole, which is useful to know when discussing the generalizability of the findings in your report.

Next, we suggest looking at the Correlations table, as shown below:

'Correlations' table for partial correlation SPSS. Shows 'Correlation', 'Significance (2-tailed)' & 'df' for each correlation

Published with written permission from SPSS Statistics, IBM Corporation.

The Correlations table is split into two main parts: (a) the Pearson product-moment correlation coefficients for all your variables – that is, your dependent variable, independent variable, and one or more control variables – as highlighted by the blue rectangle; and (b) the results from the partial correlation where the Pearson product-moment correlation coefficient between the dependent and independent variable has been adjusted to take into account the control variable(s), as highlighted by the red rectangle.

Note: You can always identify the first part of the Correlations table, which contains the Pearson product-moment correlation coefficients for all your variables because this will be labelled "-none-a" in the far left-hand column of the table. These are also known as zero-order correlations. The second part of the table, which presents results of the partial correlation will contain the label of the control variable in the far left-hand column (i.e., in our example, "Age").

The results of the partial correlation highlighted by the red rectangle show that there was a moderate, negative partial correlation between the dependent variable, "VO2max", and independent variable, "weight", whilst controlling for "age", which was statistically significant (r(97) = -.314, n = 100, p = .002). However, when we refer to the Pearson's product-moment correlation – also known as the zero-order correlation – between "VO2max" and "weight", without controlling for "age", as highlighted by the blue rectangle, we can see that there was also a statistically significant, moderate, negative correlation between "VO2max" and "weight" (r(98) = -.307, n = 100, p = .002). This suggests that "age" had very little influence in controlling for the relationship between "VO2max" and "weight".

SPSS Statistics

Reporting the results of a partial correlation

In our example above, you might present the results as follows:

A partial correlation was run to determine the relationship between an individual's VO2max and weight whilst controlling for age. There was a moderate, negative partial correlation between VO2max (43.63 ± 8.57 ml/min/kg) and weight (79.66 ± 15.09 kg) whilst controlling for age (31.1 ± 9.1 years), which was statistically significant, r(97) = -.314, N = 100, p = .002. However, zero-order correlations showed that there was a statistically significant, moderate, negative correlation between VO2max and weight (r(98) = -.307, n = 100, p < .002), indicating that age had very little influence in controlling for the relationship between VO2max and weight.

Join the 10,000s of students, academics and professionals who rely on Laerd Statistics.TAKE THE TOUR
1