Cronbach's Alpha (α) using SPSS Statistics
Introduction
Cronbach's alpha is the most common measure of internal consistency ("reliability"). It is most commonly used when you have multiple Likert questions in a survey/questionnaire that form a scale and you wish to determine if the scale is reliable. If you are concerned with inter-rater reliability, we also have a guide on using Cohen's (κ) kappa that you might find useful.
SPSS Statistics
Example used in this guide
A researcher has devised a nine-question questionnaire to measure how safe people feel at work at an industrial complex. Each question was a 5-point Likert item from "strongly disagree" to "strongly agree". In order to understand whether the questions in this questionnaire all reliably measure the same latent variable (feeling of safety) (so a Likert scale could be constructed), a Cronbach's alpha was run on a sample size of 15 workers.
SPSS Statistics
Data setup in SPSS Statistics to carry out a Cronbach's alpha
In SPSS Statistics, the nine questions have been labelled Qu1 through to Qu9. To know how to correctly enter your data into SPSS Statistics in order to run a Cronbach's alpha test, see our guide: Entering Data into SPSS Statistics. Alternately, you can learn about our enhanced data setup content on our Features: Data Setup page.
SPSS Statistics
SPSS Statistics procedure to carry out a Cronbach's alpha
Cronbach's alpha can be carried out in SPSS Statistics using the Reliability Analysis... procedure. In this section, we set out this 7-step procedure depending on whether you have versions 26 to 30 (or the subscription version of SPSS Statistics) or version 25 or an earlier version of SPSS Statistics. The latest versions of SPSS Statistics are version 30 and the subscription version. If you are unsure which version of SPSS Statistics you are using, see our guide: Identifying your version of SPSS Statistics. At the end of these seven steps, we show you how to interpret the results from your Cronbach's alpha analysis.
SPSS Statistics versions 26 to 30
(and the subscription version of SPSS Statistics)
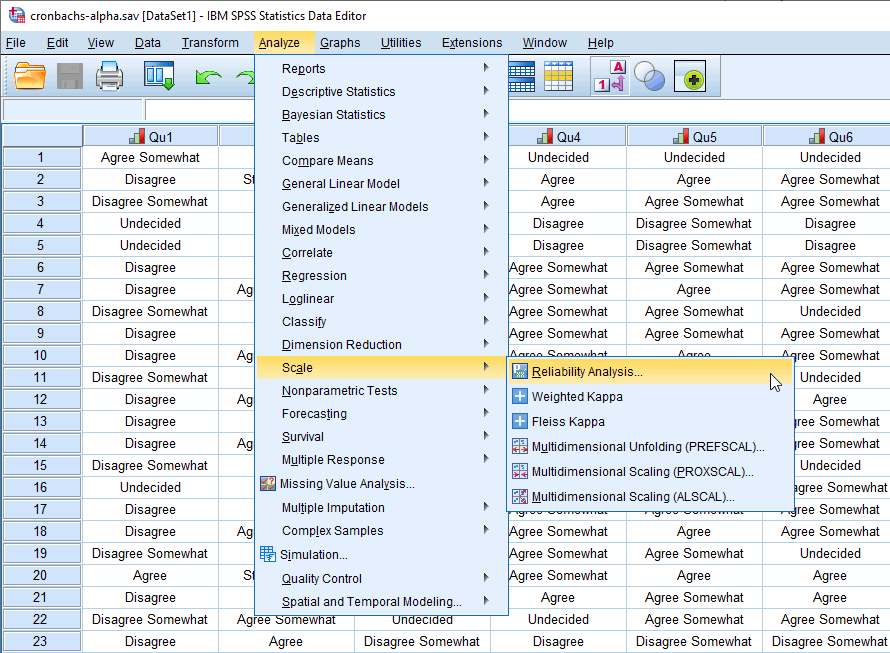
- Click Analyze > Scale > Reliability Analysis... on the top menu, as shown below:
Note: In version 27 and the subscription version, SPSS Statistics introduced a new look to their interface called "SPSS Light", replacing the previous look for versions 26 and earlier versions, which was called "SPSS Standard". Therefore, if you have SPSS Statistics versions 27 to 30 (or the subscription version of SPSS Statistics), the images that follow will be light grey rather than blue. However, the procedure is identical in SPSS Statistics versions 26 to 30 (and the subscription version of SPSS Statistics).

Published with written permission from SPSS Statistics, IBM Corporation.
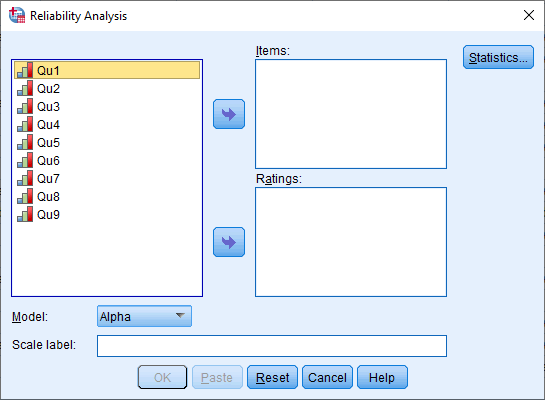
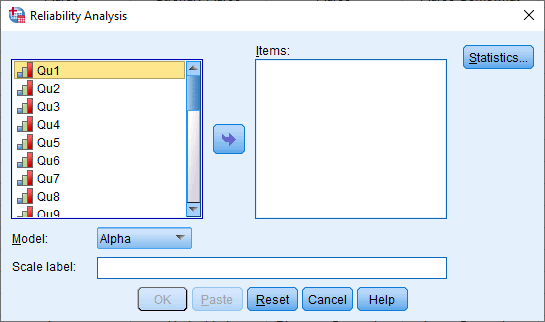
You will be presented with the following Reliability Analysis dialogue box:
Published with written permission from SPSS Statistics, IBM Corporation.
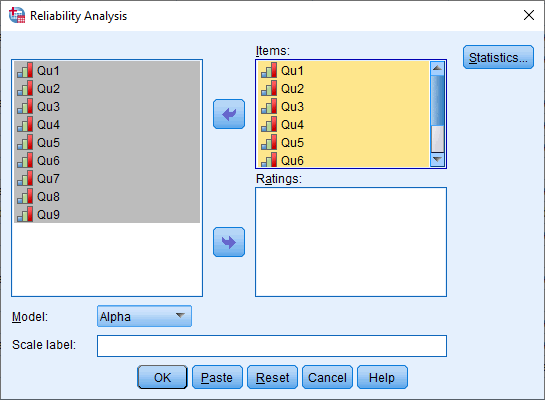
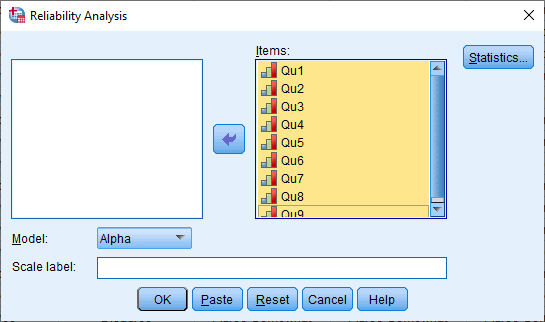
- Transfer the variables Qu1 to Qu9 into the Items: box. You can do this by drag-and-dropping the variables into their respective boxes or by using the button. You will be presented with the following screen:
Published with written permission from SPSS Statistics, IBM Corporation.
- Leave the Model: option set as , which instructs SPSS Statistics to run Cronbach's alpha.
Note: If you want to provide a name for the scale, enter it in the Scale label: box. Since this only prints the name you enter at the top of the SPSS Statistics output, it is certainly not essential that you do (in our example, we leave it blank).
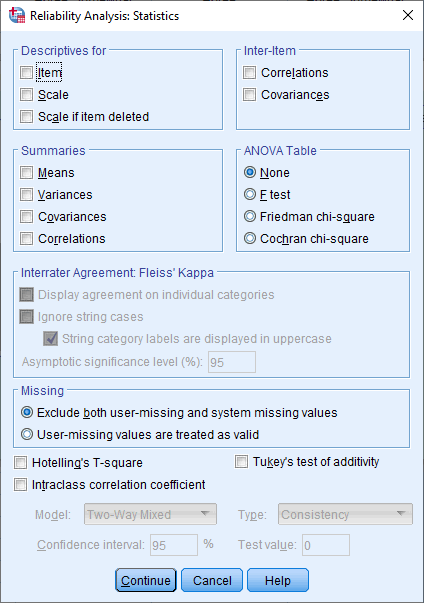
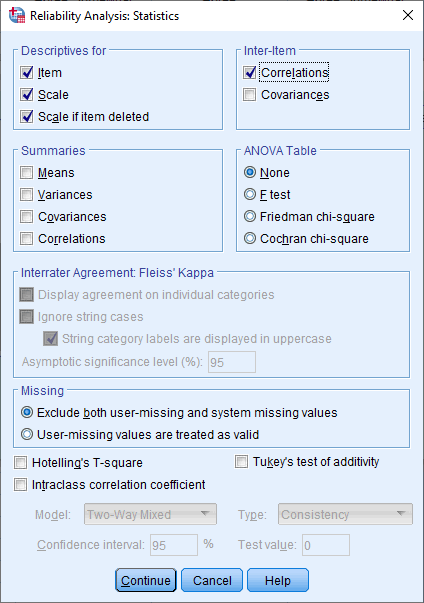
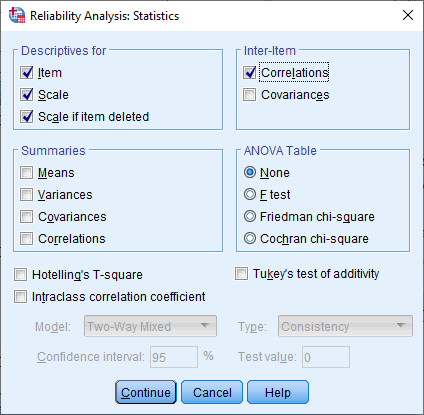
- Click on the button. You will be presented with the Reliability Analysis: Statistics dialogue box, as shown below:
Published with written permission from SPSS Statistics, IBM Corporation.
- Select the Item, Scale and Scale if item deleted options in the –Descriptives for– area, and the Correlations option in the –Inter-Item– area, as shown below:
Published with written permission from SPSS Statistics, IBM Corporation.
- Click on the button. This will return you to the Reliability Analysis dialogue box.
- Click on the button to generate the output.
Now that you have run the Cronbach's alpha procedure, we show you how to interpret your results in the Interpreting Results section. You can skip the section below, which shows you how to carry out Cronbach's alpha when you have SPSS Statistics version 25 or an earlier versions of SPSS Statistics.
SPSS Statistics version 25
and earlier versions of SPSS Statistics
- Click Analyze > Scale > Reliability Analysis... on the top menu, as shown below:
Published with written permission from SPSS Statistics, IBM Corporation.
You will be presented with the following Reliability Analysis dialogue box:
Published with written permission from SPSS Statistics, IBM Corporation.
- Transfer the variables Qu1 to Qu9 into the Items: box. You can do this by drag-and-dropping the variables into their respective boxes or by using the button. You will be presented with the following screen:
Published with written permission from SPSS Statistics, IBM Corporation.
- Leave the Model: option set as , which instructs SPSS Statistics to run Cronbach's alpha.
Note: If you want to provide a name for the scale, enter it in the Scale label: box. Since this only prints the name you enter at the top of the SPSS Statistics output, it is certainly not essential that you do (in our example, we leave it blank).
- Click on the button. You will be presented with the Reliability Analysis: Statistics dialogue box, as shown below:
Published with written permission from SPSS Statistics, IBM Corporation.
- Select the Item, Scale and Scale if item deleted options in the –Descriptives for– area, and the Correlations option in the –Inter-Item– area, as shown below:
Published with written permission from SPSS Statistics, IBM Corporation.
- Click on the button. This will return you to the Reliability Analysis dialogue box.
- Click on the button to generate the output.
Now that you have run the Cronbach's alpha procedure, we show you how to interpret your results in the next section.
SPSS Statistics
Interpreting the SPSS Statistics output for Cronbach's alpha
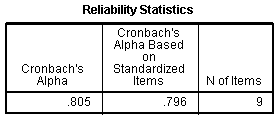
SPSS Statistics produces many different tables. The first important table is the Reliability Statistics table that provides the actual value for Cronbach's alpha, as shown below:
Published with written permission from SPSS Statistics, IBM Corporation.
From our example, we can see that Cronbach's alpha is 0.805, which indicates a high level of internal consistency for our scale with this specific sample.
SPSS Statistics
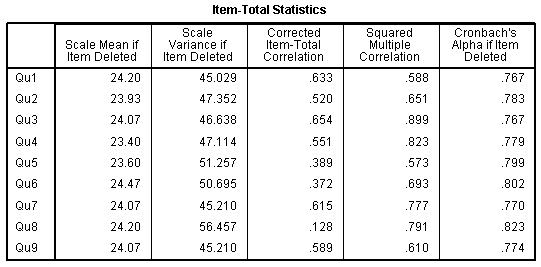
Item-Total Statistics
The Item-Total Statistics table presents the "Cronbach's Alpha if Item Deleted" in the final column, as shown below:
Published with written permission from SPSS Statistics, IBM Corporation.
This column presents the value that Cronbach's alpha would be if that particular item was deleted from the scale. We can see that removal of any question, except question 8, would result in a lower Cronbach's alpha. Therefore, we would not want to remove these questions. Removal of question 8 would lead to a small improvement in Cronbach's alpha, and we can also see that the "Corrected Item-Total Correlation" value was low (0.128) for this item. This might lead us to consider whether we should remove this item.
Cronbach's alpha simply provides you with an overall reliability coefficient for a set of variables (e.g., questions). If your questions reflect different underlying personal qualities (or other dimensions), for example, employee motivation and employee commitment, Cronbach's alpha will not be able to distinguish between these. In order to do this and then check their reliability (using Cronbach's alpha), you will first need to run a test such as a principal components analysis (PCA). You can learn how to carry out principal components analysis (PCA) using SPSS Statistics, as well as interpret and write up your results, in our enhanced content. You can learn more on our Features: Overview page. It is also possible to run Cronbach's alpha in Minitab.