Cohen's kappa using SPSS Statistics
Introduction
In research designs where you have two or more raters (also known as "judges" or "observers") who are responsible for measuring a variable on a categorical scale, it is important to determine whether such raters agree. Cohen's kappa (κ) is such a measure of inter-rater agreement for categorical scales when there are two raters (where κ is the lower-case Greek letter 'kappa').
There are many occasions when you need to determine the agreement between two raters. For example, the head of a local medical practice might want to determine whether two experienced doctors at the practice agree on when to send a patient to get a mole checked by a specialist. Both doctors look at the moles of 30 patients and decide whether to "refer" or "not refer" the patient to a specialist (i.e., where "refer" and "not refer" are two categories of a nominal variable, "referral decision"). The level of agreement between the two doctors for each patient is analysed using Cohen's kappa. Since the results showed a very good strength of agreement between the two doctors, the head of the local medical practice feels somewhat confident that both doctors are diagnosing patients in a similar manner. However, it is worth noting that even if two raters strongly agree, this does not necessarily mean that their decision is correct (e.g., both doctors could be misdiagnosing the patients, perhaps referring them too often when it is not necessary). This is something that you have to take into account when reporting your findings, but it cannot be measured using Cohen's kappa (when comparing two the doctors).
Note: There are variations of Cohen's kappa (κ) that are specifically designed for ordinal variables (called weighted kappa, κw) and for multiple raters (i.e., more than two raters).
This "quick start" guide shows you how to carry out Cohen's kappa using SPSS Statistics, as well as interpret and report the results from this test. However, before we introduce you to this procedure, you need to understand the different assumptions that your data must meet in order for Cohen's kappa to give you a valid result. We discuss these assumptions next.
SPSS Statistics
Basic requirements and assumptions of Cohen's kappa
Cohen's kappa has five assumptions that must be met. If these assumptions are not met, you cannot use Cohen's kappa, but may be able to use another statistical test instead. Therefore, in order to run a Cohen's kappa, you need to check that your study design meets the following five assumptions:
- Assumption #1: The response (e.g., judgement) that is made by your two raters is measured on a nominal scale (i.e., either an ordinal or nominal variable) and the categories need to be mutually exclusive. For example, the two raters could be assessing whether a patient's mole was "normal" or "suspicious" (i.e., two categories); whether the quality of service provided by a customer service agent was "above average", "average" or "below average" (i.e., three categories); or whether a person's activity level should be considered "sedentary", "low", "medium" or "high" (i.e., four categories). In addition, the categories being assessed by the two raters should be "mutually exclusive", which means that no categories overlap (e.g., a rater could only consider a patient's mole to be normal OR suspicious; the mole cannot be normal and suspicious at the same time).
- Assumption #2: The response data are paired observations of the same phenomenon, meaning that both raters assess the same observations. Take the example above of two experienced doctors who were asked to look at the moles of 30 patients and decide whether to "refer" or "not refer" each patient to a specialist. A single paired observation reflects the assessment of "Doctor 1" for "Patient 1" compared to the assessment of "Doctor 2" for "Patient 1" (i.e., they are comparing the same patient). With 30 patients in the study, this means that there are 30 paired observations.
- Assumption #3: Each response variable must have the same number of categories and the crosstabulation must be symmetric (i.e., "square") (e.g., a 2x2 crosstabulation, 3x3 crosstabulation, 4x4 crosstabulation, etc.). For example, a 2x2 crosstabulation means that the responses of both raters are measured on a dichotomous scale; that is, a nominal scale with two categories (e.g., no scarring vs scarring; more trustworthy vs less trustworthy; resuscitate vs do not resuscitate; and so forth). Therefore, a 3x3 crosstabulation would mean that the responses for both raters were measured on a nominal scale with three categories (e.g., complete information recall vs some information recall vs no information recall), whilst a 4x4 crosstabulation involves a nominal variable with four categories (e.g., undecided voter vs floating voter vs protest voter vs partisan voter).
- Assumption #4: The two raters are independent (i.e., one rater's judgement does not affect the other rater's judgement). For example, if the two doctors in the example above discuss their assessment of the patients' moles before recording their response (i.e., "refer" or "not refer") or perhaps are simply in the same room when they make their assessment, this could influence the assessment they make. It is important that the potential for such bias is removed from the study design as much as is possible.
- Assumption #5: The same two raters are used to judge all observations (e.g., patients). This has been referred to as having fixed or unique raters. If different raters were used for each observation (e.g., patient), Cohen's kappa is not the appropriate test to use. However, in this latter case, you could use Fleiss' kappa instead, which allows randomly chosen raters for each observation (e.g., patient).
If your study design does not meet these five assumptions, you will not be able to run a Cohen's kappa. If you would like to know more about the characteristics of Cohen's kappa, including the null and alternative hypothesis it is testing, see our enhanced Cohen's kappa guide. In the section, Test Procedure in SPSS Statistics, we show you how to analyse your data using Cohen's kappa in SPSS Statistics. First, we introduce you to the example we use in this guide.
SPSS Statistics
Example used in this guide
A local police force wanted to determine whether two police officers with a similar level of experience were able to detect whether the behaviour of people in a retail store was "normal" or "suspicious" (N.B., the retail store sold a wide range of clothing items).
The two police officers were shown 100 randomly selected video clips. Each video clip captured the movement of just one individual from the moment that they entered the retail store to the moment they exited the store. At the end of each video clip, each police officer was asked to record whether they considered the person's behaviour to be "normal" or "suspicious".
After both police officers had rated all of the 100 video clips, Cohen's kappa was used to compare the ratings of the two officers.
Note: Both police officers viewed the same 100 video clips. Also, the ratings of the two police officers (i.e., either "normal" or "suspicious" behaviour) were compared for the same people (i.e., the rating given by Police Officer 1 for Person 1 was compared to the rating given by Police Officer 2 for Person 1, and so forth).
SPSS Statistics
Data setup in SPSS Statistics to carry out a Cohen's kappa
For a Cohen's kappa, you will have two variables. In this example, these are: (1) the scores for "Rater 1", Officer1, which reflect Police Officer 1's decision to rate a person's behaviour as being either "normal" or "suspicious"; and (2) the scores for "Rater 2", Officer2, which reflect Police Officer 2's decision to rate a person's behaviour as being either "normal" or "suspicious". If you are unsure how to correctly enter these variables into the Variable View and Data View of SPSS Statistics so that you can carry out your analysis, we show you how in our enhanced Cohen's kappa guide. You can learn about our enhanced data setup content on our Features: Data Setup page or you can become a member of Laerd Statistics to access our enhanced Cohen's kappa guide.
SPSS Statistics
SPSS Statistics procedure to carry out a Cohen's kappa
The 8-step Crosstabs... procedure below shows you how to analyse your data using Cohen's kappa in SPSS Statistics. At the end of these eight steps, we show you how to interpret the results from this test.
Note 1: The procedure that follows is identical for SPSS Statistics versions 18 to 30, as well as the subscription version of SPSS Statistics, with version 30 and the subscription version being the latest versions of SPSS Statistics. However, in version 27 and the subscription version, SPSS Statistics introduced a new look to their interface called "SPSS Light", replacing the previous look for versions 26 and earlier versions, which was called "SPSS Standard". Therefore, if you have SPSS Statistics versions 27 to 30 (or the subscription version of SPSS Statistics), the images that follow will be blue rather than light grey. However, the procedure is identical.
Note 2: If you are unsure which version of SPSS Statistics you are using, see our guide: Identifying your version of SPSS Statistics.
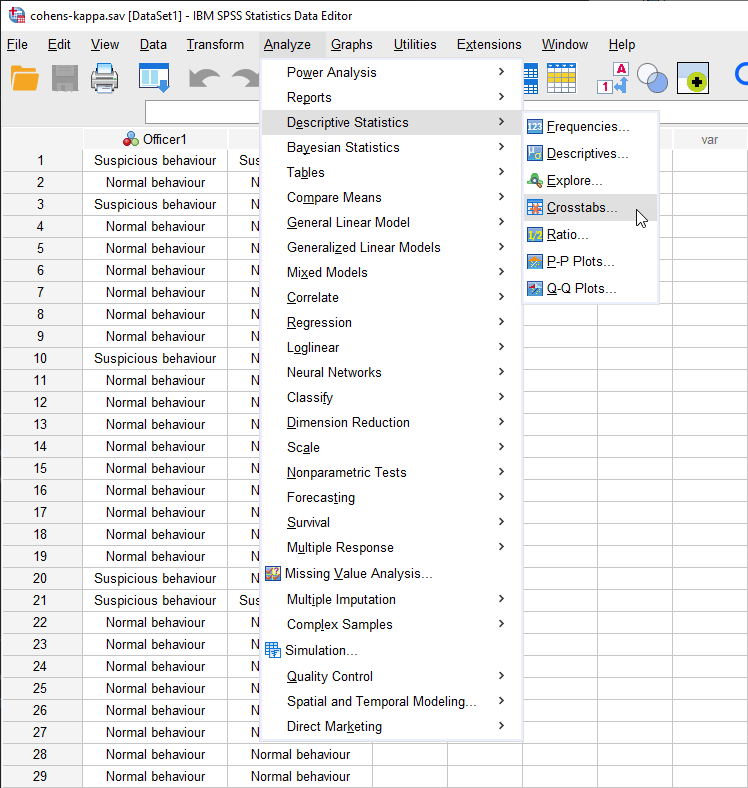
- Click Analyze > Descriptive Statistics > Crosstabs... on the main menu:

Published with written permission from SPSS Statistics, IBM Corporation.
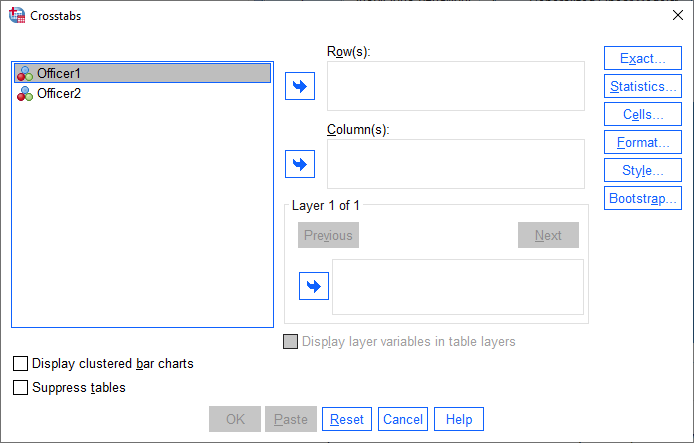
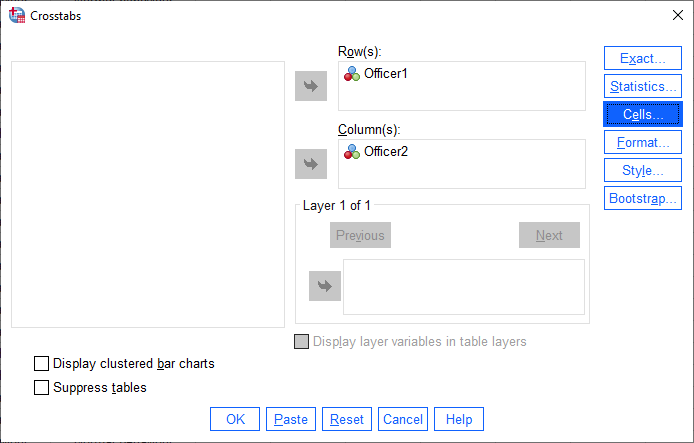
You will be presented with the Crosstabs dialogue box, as shown below:
Published with written permission from SPSS Statistics, IBM Corporation.
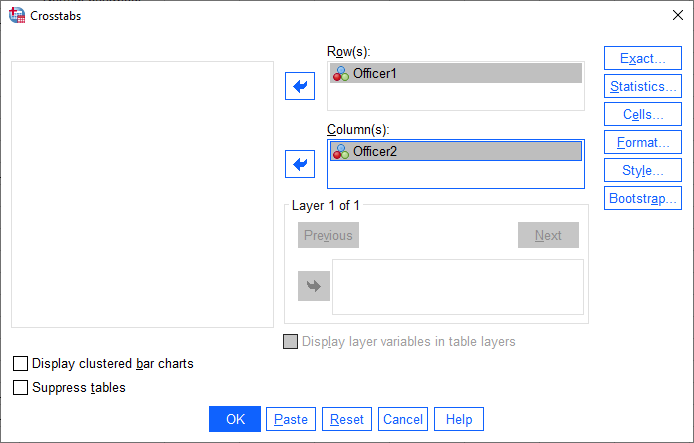
- You need to transfer one variable (e.g., Officer1) into the Row(s): box, and the second variable (e.g., Officer2) into the Column(s): box. To do this, highlight each variable separately and use the button to move them into the Row(s): and Column(s): boxes. You will end up with a screen similar to the one below:
Published with written permission from SPSS Statistics, IBM Corporation.
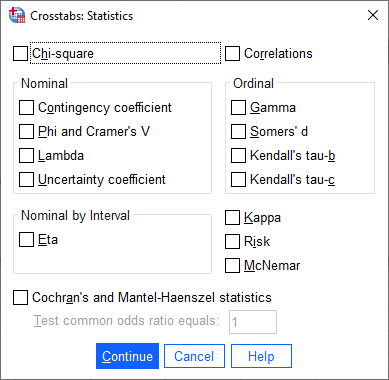
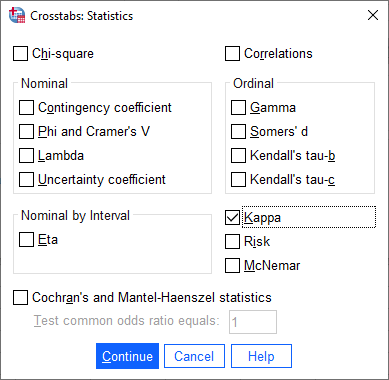
- Click on the button. You will be presented with the Crosstabs: Statistics dialogue box, as shown below:
Published with written permission from SPSS Statistics, IBM Corporation.
- Select the Kappa checkbox. You will end up with the dialogue box below:
Published with written permission from SPSS Statistics, IBM Corporation.
- Click on the button and you will be returned to the Crosstabs dialogue box.
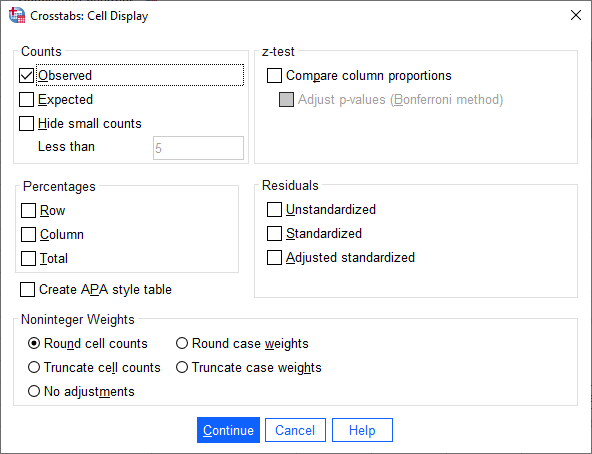
- Click on the button. You will be presented with the Crosstabs: Cell Display dialogue box, as shown below:
Published with written permission from SPSS Statistics, IBM Corporation.
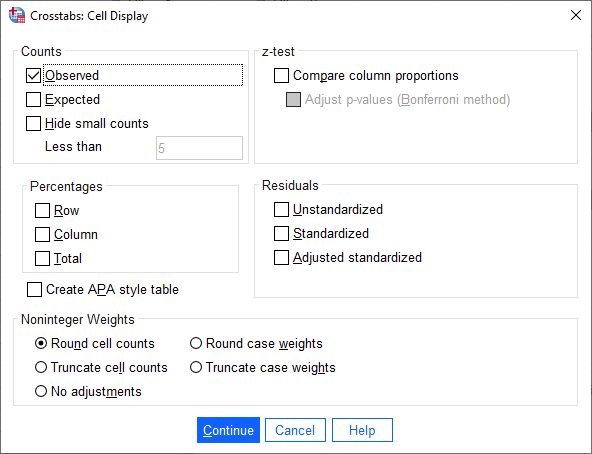
- Keep the Observed checkbox selected, as shown below:
Published with written permission from SPSS Statistics, IBM Corporation.
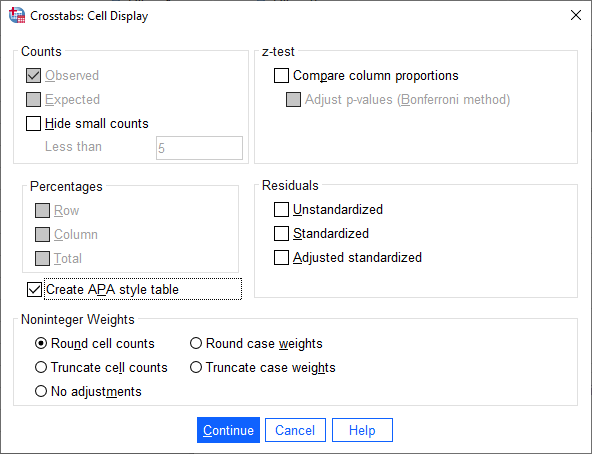
Note: If you have SPSS Statistics versions 27 to 30 (or the subscription version of SPSS Statistics), and you want to create a Crosstabulations table in the APA Style, click on the Create APA style table checkbox, as shown below:
If you have SPSS Statistics version 26 or an earlier version of SPSS Statistics, you will not see the the Create APA style table checkbox because this feature was introduced in SPSS Statistics version 27.
- Click on the button. You will be returned to the Crosstabs dialogue box, as shown below:
Published with written permission from SPSS Statistics, IBM Corporation.
- Click on the button to generate the output for Cohen's kappa.
Now that you have run the Cohen's kappa procedure, we show you how to interpret and report your results.
SPSS Statistics
Interpreting the SPSS Statistics output for Cohen's kappa
SPSS Statistics generates two main tables of output for Cohen's kappa: the Crosstabulation table and Symmetric Measures table. These are discussed in turn below:
Crosstabulation Table
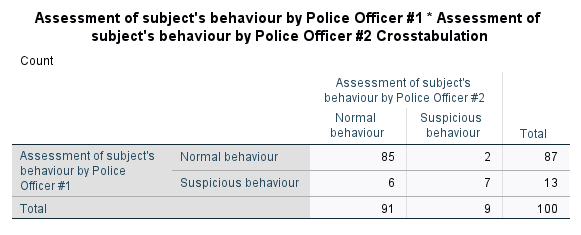
Before reporting the actual result of Cohen's kappa (κ), it is useful to examine summaries of your data to get a better 'feel' for your results. The table generated by SPSS Statistics is a crosstabulation of the categories of the two variables (and sometimes called a 'confusion matrix') and is entitled the Crosstabulation table, as shown below :
Published with written permission from SPSS Statistics, IBM Corporation.
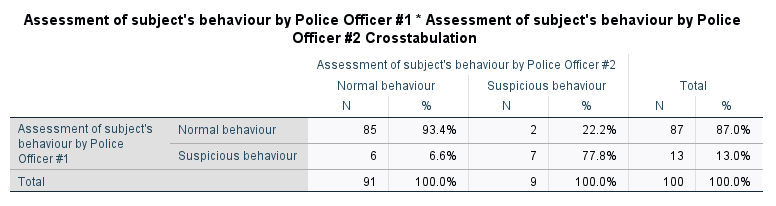
Note: If you have SPSS Statistics versions 27 to 30 (or the subscription version of SPSS Statistics), and selected the Create APA style table checkbox in Step 6 of the Crosstabs... procedure earlier, you will have generated the following Crosstabulation table, formatted in the APA Style:
We can use the Crosstabulation table, amongst other things, to understand the degree to which the two raters (i.e., both police officers) agreed and disagreed on their judgement of suspicious behaviour. You can see from the table above that of the 100 people evaluated by the police officers, 85 people displayed normal behaviour as agreed by both police officers. In addition, both officers agreed that there were seven people who displayed suspicious behaviour. Therefore, there were eight individuals (i.e., 6 + 2 = 8) for whom the two police officers could not agree on their behaviour.
Symmetric Measures Table
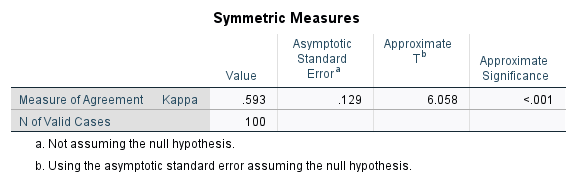
The Symmetric Measures table presents the Cohen's kappa (κ), which is a statistic designed to take into account chance agreement. Essentially, even if the two police officers in this example were to guess randomly about each individual's behaviour, they would end up agreeing on some individual's behaviour simply by chance, but you don't want this chance agreement polluting your results (i.e., making agreement appear better than it actually is). Instead of measuring the overall proportion of agreement (which we calculated above), Cohen's kappa measures the proportion of agreement over and above the agreement expected by chance (i.e., chance agreement).
Published with written permission from SPSS Statistics, IBM Corporation.
You can see that Cohen's kappa (κ) is .593. This is the proportion of agreement over and above chance agreement. Cohen's kappa (κ) can range from -1 to +1. Based on the guidelines from Altman (1999), and adapted from Landis & Koch (1977), a kappa (κ) of .593 represents a moderate strength of agreement. Furthermore, since p < .001 (i.e., p is less than .001), our kappa (κ) coefficient is statistically significantly different from zero.
SPSS Statistics
Reporting the results of Cohen's kappa
Based on the results above, we could report the results of the study as follows:
Cohen's κ was run to determine if there was agreement between two police officers' judgement on whether 100 individuals in a shopping mall were exhibiting normal or suspicious behaviour. There was moderate agreement between the two officers' judgements, κ = .593 (95% CI, .300 to .886), p < .001.
You'll notice that the Cohen's kappa write-up above includes not only the kappa (κ) statistics and p-value, but also the 95% confidence interval (95% CI). In our enhanced Cohen's kappa guide, we show you how to calculate these confidence intervals from your results, as well as how to incorporate the descriptive information from the Crosstabulation table into your write-up. We also show you how to write up the results using the Harvard and APA styles. You can learn more about the Cohen's kappa test, how to set up your data in SPSS Statistics, and how to interpret and write up your findings in more detail in our enhanced Cohen's kappa guide, which you can access by becoming a member of Laerd Statistics.
SPSS Statistics
References
Altman, D. G. (1999). Practical statistics for medical research. New York, NY: Chapman & Hall/CRC Press.
Landis, J. R., & Koch, G. G. (1977). The measurement of observer agreement for categorical data. Biometrics, 33, 159-174.