Cronbach's alpha using Minitab
Introduction
Cronbach's alpha is a common measure of internal consistency ("reliability"), often used when you have multiple Likert questions in a survey/questionnaire that form a scale and you want to determine if the scale is reliable. It is also often used in conjunction with a data reduction technique such as principal components analysis (PCA) or factor analysis.
For example, imagine a researcher wanted to create a questionnaire that measured "job satisfaction". The questionnaire consisted of eight questions and was completed by a sample of 60 participants. The researcher was satisfied that the eight questions were measuring the "job satisfaction" construct, but wished to know if they were reliably measuring this construct, (i.e., whether the questions used to measure job satisfaction were "internally consistent"). To measure this internal consistency, the researcher calculated Cronbach's alpha for this eight-question questionnaire.
Note: When using a Cronbach's alpha, your variables (e.g., the questions in a questionnaire) are often referred to as "items". When these items are grouped together (e.g., all the questions in a questionnaire), it is often referred to as a "scale".
In this "quick start" guide, we show you how to carry out a Cronbach's alpha using Minitab, as well as interpret and report the results from this test. First, we start with the example we use in this guide.
Minitab
Example
A questionnaire was developed that intended to determine "employee motivation". The questionnaire consisted of 6 questions (i.e., 6 "items"). A total of 315 participants completed the questionnaire. Each question was measured using a 5-point Likert item from "strongly disagree" to "strongly agree". In order to understand whether the questions in this questionnaire were internally consistent, a Cronbach's alpha was run.
Minitab
Setup in Minitab
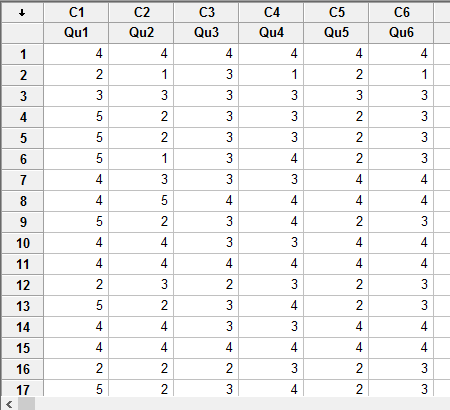
In Minitab, we set up the six items that reflected the six questions in our questionnaire (i.e., questions ![]() through to
through to ![]() in columns
in columns ![]() through to
through to ![]() ). For example, under column
). For example, under column ![]() we entered the name of the first question in our questionnaire, Qu1, as follows:
we entered the name of the first question in our questionnaire, Qu1, as follows: ![]() . We then did this for
. We then did this for ![]() through to
through to ![]() . Finally, we entered the scores for each of the six items (i.e., how each participant responded to each of the six questions). These responses were coded from "1" to "5" based on the 5-point Likert item (i.e., "1" for "strongly disagree" through to "5" for "strongly agree"). This is illustrated below:
. Finally, we entered the scores for each of the six items (i.e., how each participant responded to each of the six questions). These responses were coded from "1" to "5" based on the 5-point Likert item (i.e., "1" for "strongly disagree" through to "5" for "strongly agree"). This is illustrated below:
Published with written permission from Minitab Inc.
Minitab
Test Procedure in Minitab
In this section, we show you the three steps required to analyse your data using Cronbach's alpha in Minitab.
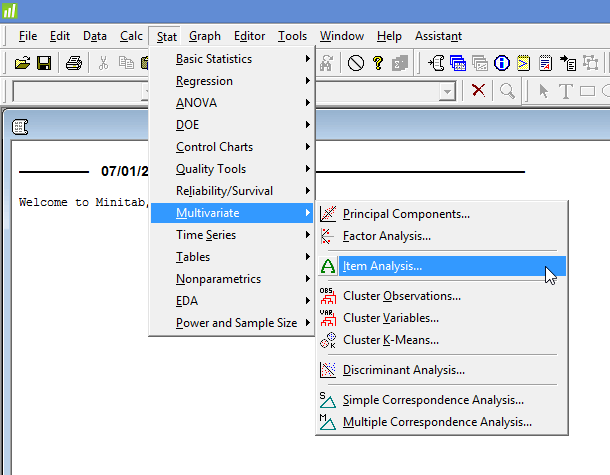
- Click Stat > Multivariate > Item Analysis... on the top menu, as shown below:

Published with written permission from Minitab Inc.
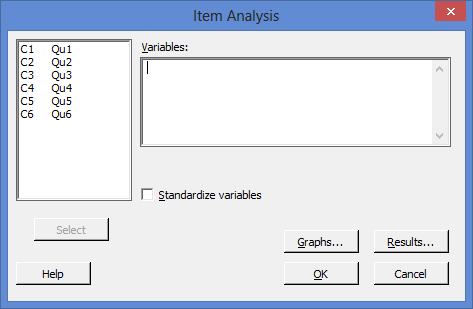
You will be presented with the following Item Analysis dialogue box:

Published with written permission from Minitab Inc.
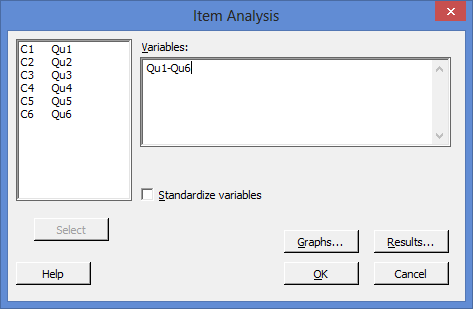
- Transfer all six items (i.e., Qu1 to Qu6) into the Variables: box. You will end up with the dialogue box shown below:

Published with written permission from Minitab Inc.
Note 1: To transfer all six items, you first need to click inside the main left-hand box and select all the items (e.g., C1 Qu1 through to C6 Qu6). This will activate the
 button (it is usually faded:
  ). Then, simply press the
  button. Alternately, you can double-click on the six items, which will automatically transfer them into the Variables: box.
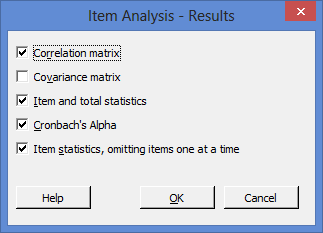
Note 2: You can change what results Minitab produces by clicking on the
 button and changing the options, but for the purposes of this "quick start" guide, we have kept the default options selected, as shown below:

- Click on the
 button. The output that Minitab produces is shown below.
Minitab
Output of the Cronbach's alpha in Minitab
The Minitab output of the Cronbach's alpha is shown below:
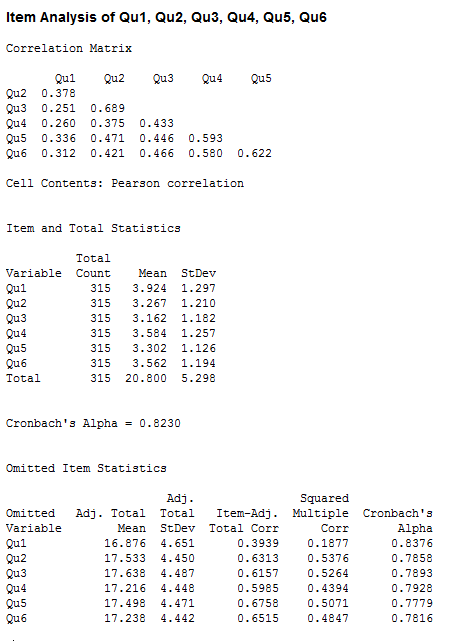
The Minitab output provides some useful descriptive statistics, including the sample size for each item (the "Total Count" column), as well as the mean and standard deviation (the "Mean" and "StDev" columns). You are also provided with the Cronbach's alpha (α) score, which in our example is 0.8230 (the Cronbach's Alpha row), indicating a high level of internal consistency for our scale. Higher values of Cronbach's alpha are better. What constitutes a good level of internal consistency differs depending on what source you refer to, but all recommended values are 0.7 or higher. Another valuable section is the final table, which shows the 'contribution' or 'fit' of each item to the scale, providing useful statistics such as the mean and standard deviation (the "Adj. Total Mean" and "Adj. Total StDev" columns), adjusted Pearson correlations and squared multiple correlation (the "Item-Adj. Total Corr" and "Squared Multiple Corr" columns), and Cronbach's alpha score (the "Cronbach's Alpha" column) if an item was removed from the scale.
Minitab
Reporting the output of a Cronbach's alpha
When you report the output of your Cronbach's alpha, it is good practice to include:
- A. An introduction to the analysis you carried out.
- B. Information about the construct you are measuring and how many items it has.
- C. A statement of the level of internal consistency, including the Cronbach's alpha score.
Based on the Minitab output above, we could report the results of this study as follows:
- General
A questionnaire was employed to measure the construct, 'employee motivation', which consisted of six questions. The scale had a high level of internal consistency, as determined by a Cronbach's alpha of 0.823.
