Login

Creating a Bar Chart using SPSS Statistics

Introduction

A simple bar chart is helpful in graphically describing (visualizing) your data. It can be used to display counts (i.e., frequencies) of the categories of a nominal or ordinal variable, as well as illustrating the mean score of a continuous variable for the categories of a nominal or ordinal variable. It will often be used in addition to inferential statistics. For example, a simple bar chart can be appropriate if you are analysing your data using an independent-samples t-test, paired-samples t-test (dependent t-test), one-way ANOVA or repeated measures ANOVA. If you are using a chi-square test for association or a two-way ANOVA, you will need to consider a clustered bar chart instead (N.B., if you need help creating a clustered bar chart using SPSS Statistics, we show you how in our enhanced content).

For example, a simple bar chart could be used to illustrate the number of times shoppers preferred one of 5 different brands of ice cream (i.e., the nominal variable would be "brand preference", which has five categories – "ice cream brand A", "ice cream brand B", "ice cream brand C", "ice cream brand D" and "ice cream brand E" – and the statistic being measured could be a "count"). The simple bar chart would highlight the relative popularity of the five different brands. Alternatively, a simple bar chart could be used to visually present the results from statistical tests such as the independent-samples t-test, one-way ANOVA, and many more. In such cases, a simple bar chart could be used to illustrate the difference in mean scores between the categories of a nominal or ordinal variable. For example, a simple bar chart could be used to illustrate the differences in the dependent variable, income, based on the three categories of the ordinal independent variable, education_level (i.e., where these three categories are "school", "college" and "university").

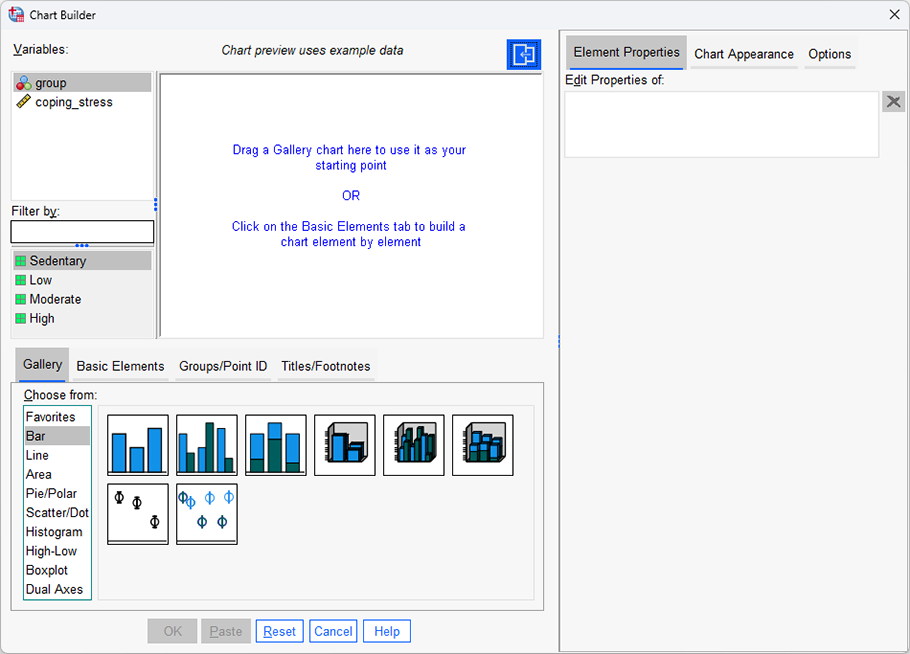
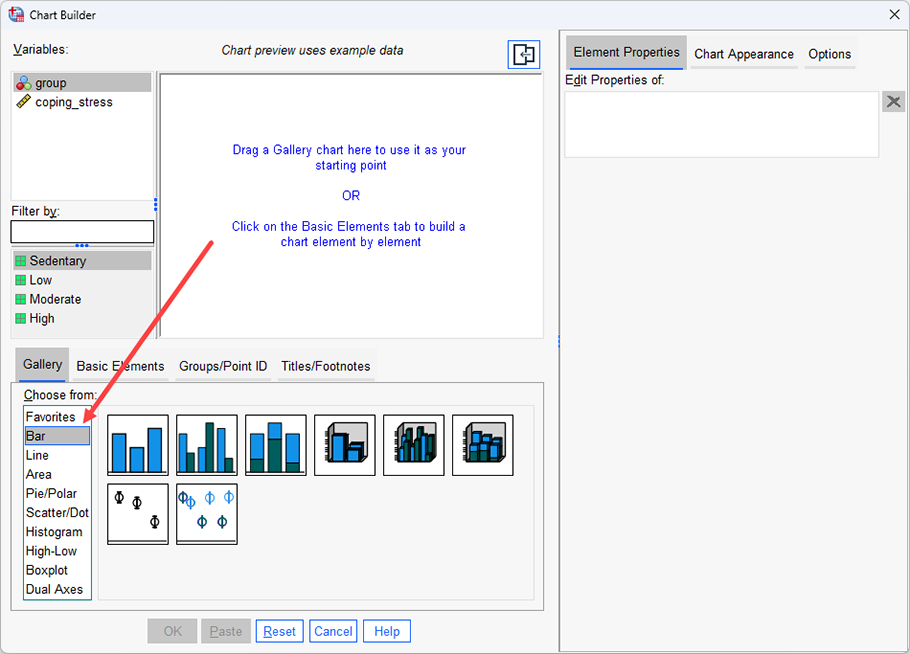
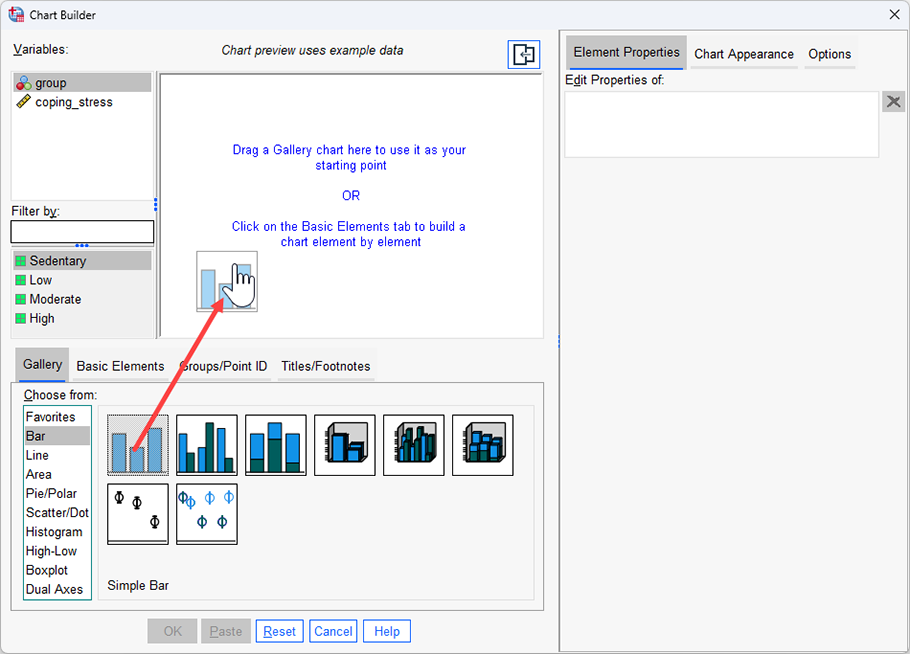
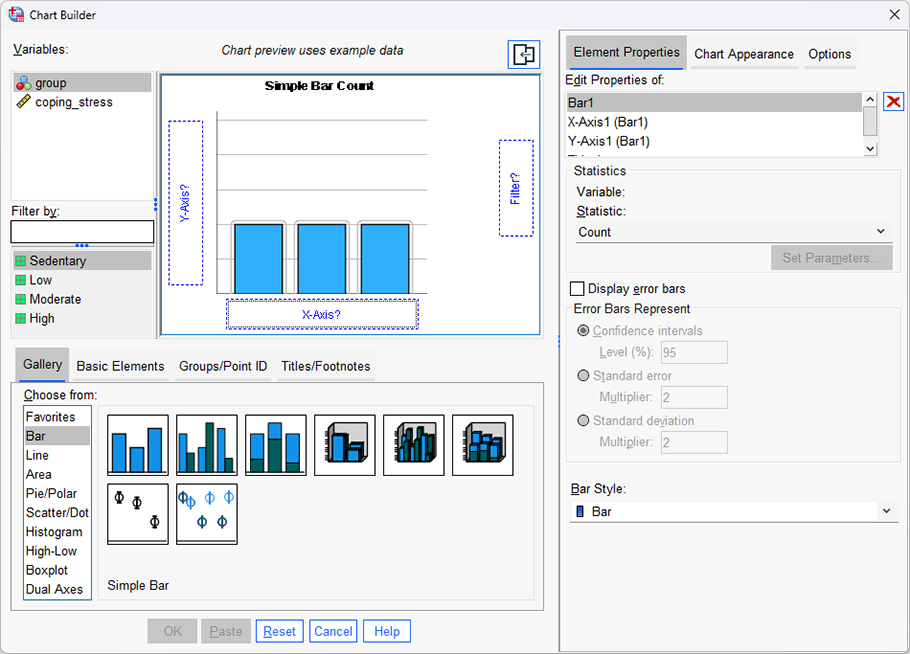
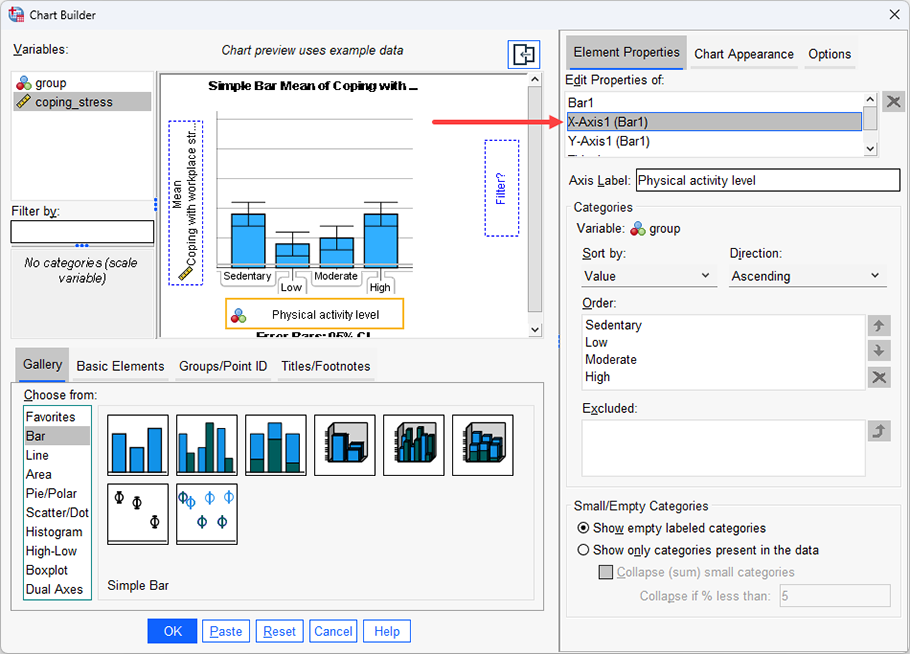
The purpose of this guide is to show you how to create a bar chart using SPSS Statistics. First, we introduce the example we have used in this guide. Next, we show how to use the Chart Builder in SPSS Statistics to create a simple bar chart based on whether you have SPSS Statistics versions 27 or 28 (or the subscription version of SPSS Statistics), versions 25 or 26, or version 24 or an earlier version of SPSS Statistics. If you are unsure which version of SPSS Statistics you are using, see our guide: Identifying your version of SPSS Statistics.

SPSS Statistics

Example

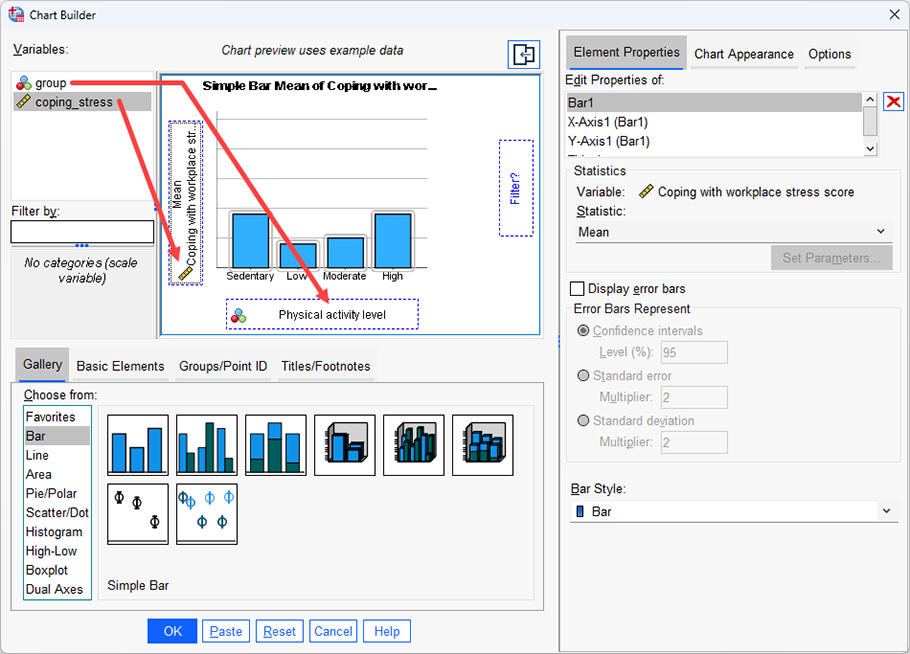
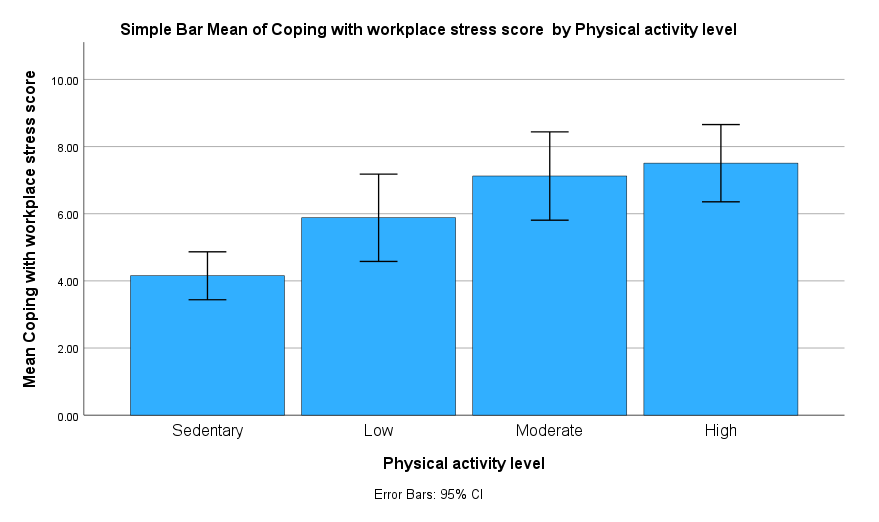
A researcher believes that individuals that are more physically active are better able to cope with stress in the workplace. To test this theory, the researcher recruited 31 subjects and measured how many minutes of physical activity they performed per week and their ability to cope with workplace stress. The subjects were categorized into four groups based on the number of minutes of physical activity they performed: namely, "sedentary", "low", "moderate" and "high" physical activity groups. These groups (levels of physical activity) formed an independent variable called group. The ability to cope with workplace stress was assessed as the average score of a series of Likert items on a questionnaire, which allowed an overall "coping with workplace stress" score to be calculated; higher scores indicating a greater ability to cope with workplace-related stress. This dependent variable was called coping_stress and "ability to cope with workplace-related stress" abbreviated as the "CWWS" score. The researcher would like to know if the CWWS score is dependent on physical activity level and uses a simple bar chart to get a "feel" for the data before carrying out a one-way ANOVA. Therefore, in this guide, the dependent variable was coping_stress, and the independent variable, group, which consisted of four groups: the "sedentary", "low", "moderate" and "high" physical activity groups.

Note: If you are using a simple bar chart to illustrate the counts (i.e., frequencies) for a single nominal or ordinal variable rather than differences in mean scores, and would like us to add a section to this guide to show how to do this, please contact us.

Testimonials
TAKE THE TOUR


SPSS Statistics

SPSS Statistics procedure for versions 27 and 28
(and the subscription version of SPSS Statistics)

The 10 steps that follow show you how to create a simple bar chart in SPSS Statistics versions 27 and 28 (and the subscription version of SPSS Statistics) using the example above.

  1. Click Graphs > Chart Builder... on the main menu, as shown below:
    'Chart Builder' menu for a simple bar chart in SPSS Statistics

    Published with written permission from SPSS Statistics, IBM Corporation.


    You will be presented with the Chart Builder dialogue box, as shown below:
    'Chart Builder' dialogue box for a simple bar chart in SPSS Statistics

    Published with written permission from SPSS Statistics, IBM Corporation.

  2. Select "Bar" from the Choose from: box in the bottom-left-hand corner of the Chart Builder dialogue box, as highlighted below:
    The 'Bar' option is highlighted

    Published with written permission from SPSS Statistics, IBM Corporation.

  3. Selecting "Bar" will present eight different bar chart options in the lower-middle section of the Chart Builder dialogue box (as shown above and below). Drag-and-drop the top-left-hand option (you will see it labelled as "Simple Bar" if you hover your mouse over the box) into the main chart preview pane, as shown below:
    Eight different bar chart options are presented. The option, 'Simple Bar', is dragged into the 'Chart Preview' box at the top

    Published with written permission from SPSS Statistics, IBM Corporation.

  4. You will be presented with the screen below, which shows a simple bar chart in the main chart preview pane with boxes for the y-axis ("Y-Axis?") and x-axis ("X-Axis?") for you to populate with the appropriate variables:
    The 'Chart Preview' pane changes, simply highlighting you are going to create a simple bar chart

    Published with written permission from SPSS Statistics, IBM Corporation.

    Note: You can ignore the "Filter?" box.

  5. Drag-and-drop the independent variable, group, from the Variables: box into the "X-Axis?" box in the main chart preview screen and do the same for the dependent variable, coping_stress, but into the "Y-Axis?" box. You should end up with a screen like the one below:
    The 'Chart Preview' changes to reflect the variables you have entered into the a-axis and y-axis of your simple bar chart

    Published with written permission from SPSS Statistics, IBM Corporation.

    Note: The chart preview pane does not accurately plot the variable data that you have dragged into the preview pane, even though it might appear that it does due to the bar chart's bars changing when you add your variables. Therefore, do not get confused and think that you have done something wrong. You will only see your true data when you actually generate the bar chart.

  6. Click Display error bars in the element properties dialogue box, which will activate the –Error Bars Represent– area. Leave Confidence intervals selected and Level (%): set at 95. You will be presented with the following screen:
    The 'Element Properties' dialogue box provides further options to edit your simple bar chart

    Published with written permission from SPSS Statistics, IBM Corporation.

    Note: You can use this area to select other types of error bars, such as multiples of either the standard error or standard deviation.

  7. Click on "Y-Axis1 (Bar1)" in the element properties dialogue box and you will be presented with the following screen:
    You can now make changes to the y-axis of your simple bar chart

    Published with written permission from SPSS Statistics, IBM Corporation.

    Note: You can use this dialogue box to change the axis label (using the Axis Label: box) and/or change scale attributes using the options in the –Scale Range– area.

  8. If you want to change the scale on the y-axis of the dependent variable, coping_stress, for example, the minimum value, uncheck the Minimum option in the –Scale Range– area so that the Custom value is highlighted and has a value of 0 (zero), as shown below. In this example, everything is OK as it is.
    Again, you can now make changes to the y-axis of your simple bar chart

    Published with written permission from SPSS Statistics, IBM Corporation.

    Note: The procedure above is intended to make the y-axis show a suitable range of values for coping_stress. These values might be different for your variables, so you should adjust them as you see fit. If you are not sure at first what these values should be, don't change the values; see what the simple bar chart looks like and then re-run the simple bar chart with new axes values if necessary. You can also re-edit the simple bar chart later on.

  9. If you want to change the order of the categories on the x-axis of the independent variable, group, click "X-Axis1 (Bar1)" in the Edit Properties of: box. This will activate the –Categories– and –Small/Empty Categories– areas, as well as the Legend Label: option. Leave the default options selected. However, if you want to change the order of the categories of the independent variable, you can do this in the Order: box in the –Categories– area using the Up and Down arrows. In this example, everything is OK as it is.
    Presents options where you can make changes to the x-axis of your simple bar chart

    Published with written permission from SPSS Statistics, IBM Corporation.

  10. Click on the OK button in the Chart Builder dialogue box to generate the simple bar chart, as shown below:
Simple bar chart showing 'coping_stress' by 'group'

Published with written permission from SPSS Statistics, IBM Corporation.

Note: If the type of simple bar chart that you want to create is different from the example above or there are specific options you want to include in your simple bar chart that we have not covered, please contact us. We will try to add a section to the guide that deals with the type of simple bar chart you want to create.

Join the 10,000s of students, academics and professionals who rely on Laerd Statistics.TAKE THE TOUR
next »