Principal Components Analysis (PCA) using SPSS Statistics
Introduction
Principal components analysis (PCA, for short) is a variable-reduction technique that shares many similarities to exploratory factor analysis. Its aim is to reduce a larger set of variables into a smaller set of 'artificial' variables, called 'principal components', which account for most of the variance in the original variables.
There are a number of common uses for PCA: (a) you have measured many variables (e.g., 7-8 variables, represented as 7-8 questions/statements in a questionnaire) and you believe that some of the variables are measuring the same underlying construct (e.g., depression). If these variables are highly correlated, you might want to include only those variables in your measurement scale (e.g., your questionnaire) that you feel most closely represent the construct, removing the others; (b) you want to create a new measurement scale (e.g., a questionnaire), but are unsure whether all the variables you have included measure the construct you are interested in (e.g., depression). Therefore, you test whether the construct you are measuring 'loads' onto all (or just some) of your variables. This helps you understand whether some of the variables you have chosen are not sufficiently representative of the construct you are interested in, and should be removed from your new measurement scale; (c) you want to test whether an existing measurement scale (e.g., a questionnaire) can be shortened to include fewer items (e.g., questions/statements), perhaps because such items may be superfluous (i.e., more than one item may be measuring the same construct) and/or there may be the desire to create a measurement scale that is more likely to be completed (i.e., response rates tend to be higher in shorter questionnaires). These are just some of the common uses of PCA. It is also worth noting that whilst PCA is conceptually different to factor analysis, in practice it is often used interchangeably with factor analysis, and is included within the 'Factor procedure' in SPSS Statistics.
In this "quick start" guide, we show you how to carry out PCA using SPSS Statistics, as well as the steps you'll need to go through to interpret the results from this test. However, before we introduce you to this procedure, you need to understand the different assumptions that your data must meet in order for PCA to give you a valid result. We discuss these assumptions next.
SPSS Statistics
Assumptions of a principal components analysis (PCA)
When you choose to analyse your data using PCA, part of the process involves checking to make sure that the data you want to analyse can actually be analysed using PCA. You need to do this because it is only appropriate to use PCA if your data "passes" four assumptions that are required for PCA to give you a valid result. In practice, checking for these assumptions requires you to use SPSS Statistics to carry out a few more tests, as well as think a little bit more about your data, but it is not a difficult task.
Before we introduce you to these four assumptions, do not be surprised if, when analysing your own data using SPSS Statistics, one or more of these assumptions is violated (i.e., not met). This is not uncommon when working with real-world data rather than textbook examples. However, even when your data fails certain assumptions, there is often a solution to try and overcome this. First, let’s take a look at these four assumptions:
- Assumption #1: You have multiple variables that should be measured at the continuous level (although ordinal variables are very frequently used). Examples of continuous variables (i.e., ratio or interval variables) include revision time (measured in hours), intelligence (measured using IQ score), exam performance (measured from 0 to 100), weight (measured in kg), and so forth. Examples of ordinal variables commonly used in PCA include a wide range o f Likert scales (e.g., a 7-point scale from 'strongly agree' through to 'strongly disagree'; a 5-point scale from 'never' to 'always'; a 7-point scale from 'not at all' to 'very much'; a 5-point scale from 'not important' to 'extremely important').
- Assumption #2: There needs to be a linear relationship between all variables. The reason for this assumption is that a PCA is based on Pearson correlation coefficients, and as such, there needs to be a linear relationship between the variables. In practice, this assumption is somewhat relaxed (even if it shouldn't be) with the use of ordinal data for variables. Although linearity can be tested using a matrix scatterplot, this is often considered overkill because the scatterplot can sometimes have over 500 linear relationships. As such, it is suggested that you randomly select just a few possible relationships between variables and test these. You can check for linearity in SPSS Statistics using scatterplots, and where there are non-linear relationships, try and "transform" these. If you choose to upgrade to our enhanced content, we have SPSS Statistics guides that show you how to test for linearity using SPSS Statistics, as well as how to carry out transformations when this assumption is violated. You can learn more about our enhanced content on our Features: Overview page.
- Assumption #3: You should have sampling adequacy, which simply means that for PCA to produce a reliable result, large enough sample sizes are required. Many different rules-of-thumb have been proposed. These mainly differ depending on whether an absolute sample size is proposed or if a multiple of the number of variables in your sample are used. Generally speaking, a minimum of 150 cases, or 5 to 10 cases per variable, has been recommended as a minimum sample size. There are a few methods to detect sampling adequacy: (1) the Kaiser-Meyer-Olkin (KMO) Measure of Sampling Adequacy for the overall data set; and (2) the KMO measure for each individual variable. In the SPSS Statistics procedure later in this guide, we show you which options to select in SPSS Statistics to test for sampling adequacy. If you are unsure how to interpret the results from these tests, we show you in our enhanced PCA guide, which is part of our enhanced content (again, you can learn more about our enhanced content on our Features: Overview page).
- Assumption #4: Your data should be suitable for data reduction. Effectively, you need to have adequate correlations between the variables in order for variables to be reduced to a smaller number of components. The method used by SPSS Statistics to detect this is Bartlett's test of sphericity. Interpretation of this test is provided as part of our enhanced PCA guide.
- Assumption #5: There should be no significant outliers. Outliers are important because these can have a disproportionate influence on your results. SPSS Statistics recommends determining outliers as component scores greater than 3 standard deviations away from the mean. Again, in the SPSS Statistics procedure later in this guide, we show you which options to select in SPSS Statistics to check for outliers. If you are unsure how to interpret the SPSS Statistics output that you need to inspect to check for outliers, we show you in our enhanced PCA guide.
You can check assumptions #2, #3, #4 and #5 using SPSS Statistics. Just remember that if you do not run the statistical tests on these assumptions correctly, the results you get when running PCA might not be valid. This is why we dedicate number of articles in our enhanced guides to help you get this right. You can find out about our enhanced content as a whole on our Features: Overview page, or more specifically, learn how we help with testing assumptions on our Features: Assumptions page.
In the section, Procedure, we illustrate the SPSS Statistics procedure that you can use to carry out PCA on your data. First, we introduce the example that is used in this guide.
SPSS Statistics
Example used in this guide
A company director wanted to hire another employee for his company and was looking for someone who would display high levels of motivation, dependability, enthusiasm and commitment (i.e., these are the four constructs we are interested in). In order to select candidates for interview, he prepared a questionnaire consisting of 25 questions that he believed might answer whether he had the correct candidates. He administered this questionnaire to 315 potential candidates. The questions were phrased such that these qualities should be represented in the questions. Questions Qu3, Qu4, Qu5, Qu6, Qu7, Qu8, Qu12, Qu13 were associated with motivation; Qu2, Qu14, Qu15, Qu16, Qu17, Qu18, Qu19 were associated with dependability; Qu20, Qu21, Qu22, Qu23, Qu24, Qu25 for enthusiasm; and Qu1, Qu9, Qu10, Qu11 for commitment. The director wanted to determine a score for each candidate so that these scores could be used to grade the potential recruits.
SPSS Statistics
Data setup in SPSS Statistics
In our enhanced PCA guide, we show you how to correctly enter data in SPSS Statistics to run a PCA. You can learn about our enhanced data setup content on our Features: Data Setup page. Alternately, see our generic, "quick start" guide: Entering Data in SPSS Statistics.
SPSS Statistics
SPSS Statistics procedure to carry out a principal components analysis (PCA)
The 18 steps below show you how to analyse your data using PCA in SPSS Statistics when none of the five assumptions in the previous section, Assumptions, have been violated. At the end of these 18 steps, we show you how to interpret the results from your PCA. If you are looking for help to make sure your data meets assumptions #2, #3, #4 and #5, which are required when using PCA, and can be tested using SPSS Statistics, we help you do this in our enhanced content (see our Features: Overview page to learn more).
The SPSS Statistics procedure for PCA is not linear (i.e., only if you are lucky will you be able to run through the following 18 steps and accept the output as your final results). You will often have to re-run these 18 steps based on (a) the results from your assumptions tests that are run during this procedure and (b) the values of the initial components that are extracted when you carry out these 18 steps. In re-running your analysis, you may have to select different options from the SPSS Statistics procedure below, or follow additional SPSS Statistics procedures to arrive at the best possible solution. We explain more about these next steps in the Output section later. First, follow the 18 steps below to attain your initial SPSS Statistics output:
Note: The procedure that follows is identical for SPSS Statistics versions 18 to 30, as well as the subscription version of SPSS Statistics, with version 30 and the subscription version being the latest versions of SPSS Statistics. However, in version 27 and the subscription version, SPSS Statistics introduced a new look to their interface called "SPSS Light", replacing the previous look for versions 26 and earlier versions, which was called "SPSS Standard". Therefore, if you have SPSS Statistics versions 27 to 30 (or the subscription version of SPSS Statistics), the images that follow will be light grey rather than blue. However, the procedure is identical.
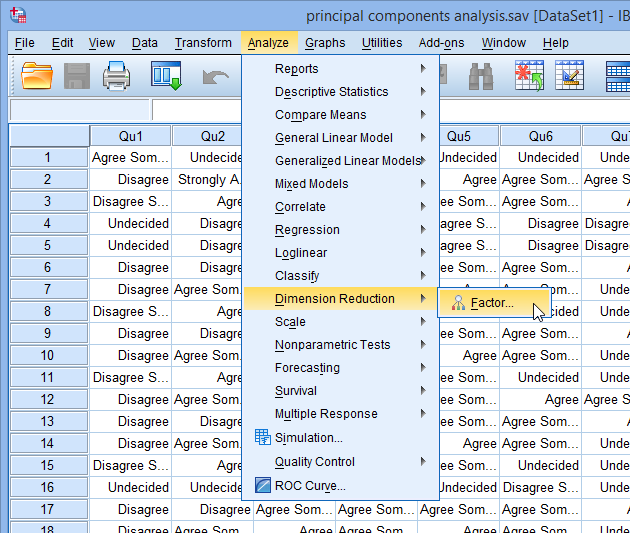
- Click Analyze > Dimension Reduction > Factor... on the main menu, as shown below:

Published with written permission from SPSS Statistics, IBM Corporation.
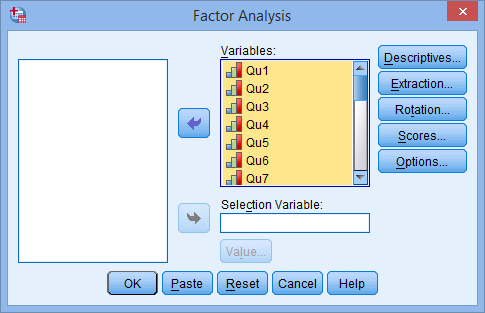
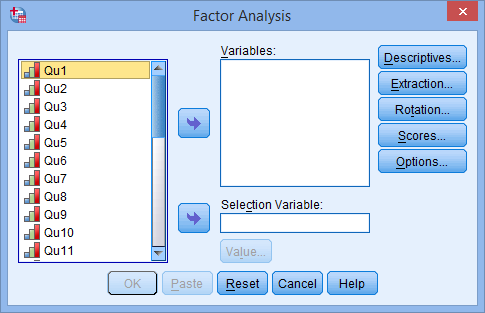
You will be presented with the Factor Analysis dialogue box below:
Published with written permission from SPSS Statistics, IBM Corporation.
- Transfer all the variables you want included in the analysis (Qu1 through Qu25, in this example), into the Variables: box by using the button, as shown below:
Published with written permission from SPSS Statistics, IBM Corporation.
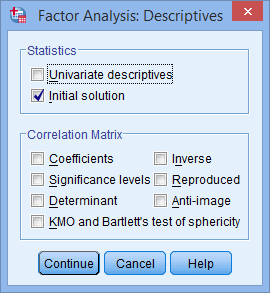
- Click on the button. You will be presented with the Factor Analysis: Descriptives dialogue box, as shown below:
Published with written permission from SPSS Statistics, IBM Corporation.
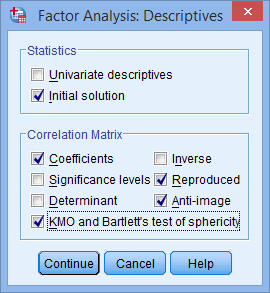
- In addition to the option that is already selected by default (i.e., Initial solution in the –Statistics– area), also check Coefficients, KMO and Bartlett's test of sphericity, Reproduced and Anti-image from the –Correlation Matrix– area. You will end up with the following screen:
Published with written permission from SPSS Statistics, IBM Corporation.
- Click on the button. You will be returned to the Factor Analysis dialogue box.
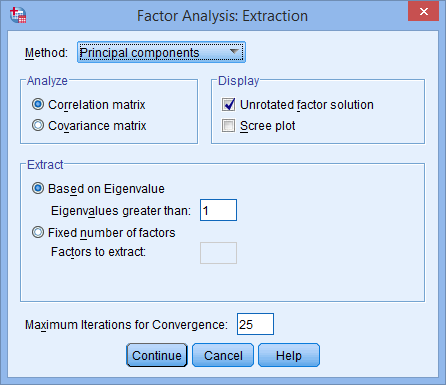
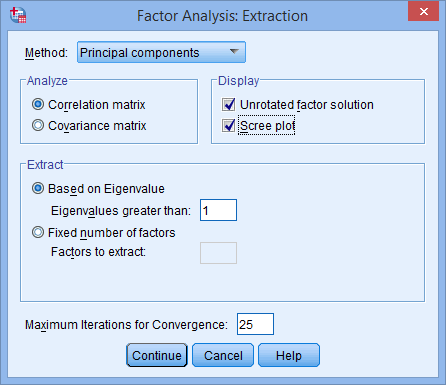
- Click on the button and you will be presented with the Factor Analysis: Extraction dialogue box, as shown below:
Published with written permission from SPSS Statistics, IBM Corporation.
- Keep all the defaults, but also select Scree plot in the –Display– area, as shown below:
Published with written permission from SPSS Statistics, IBM Corporation.
- Click on the button. You will be returned to the Factor Analysis dialogue box.
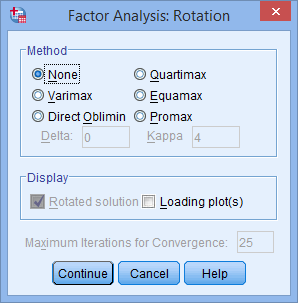
- Click on the button and you will be presented with the Factor Analysis: Rotation dialogue box, as shown below:
Published with written permission from SPSS Statistics, IBM Corporation.
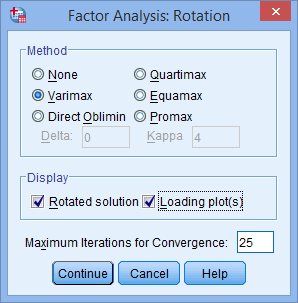
- Select the Varimax option in the –Method– area. This will activate the Rotated solution option in the –Display– area and will be checked by default (if not, make sure it is selected). Also select Loading plot(s) in the –Display– area. You will end up with a screen similar to below:
Published with written permission from SPSS Statistics, IBM Corporation.
Although not necessary in this guide, you are free to choose other rotation options to best achieve 'simple structure' (discussed later). The most common alternative is Direct Oblimin, which is an oblique transformation.
- Click on the button. You will be returned to the Factor Analysis dialogue box.
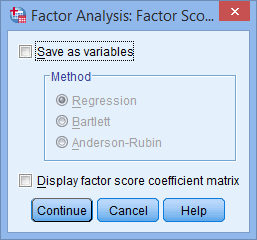
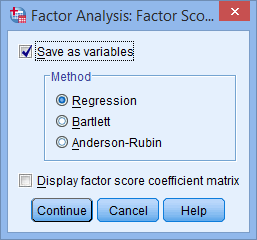
- Click on the button. You will be presented with the Factor Analysis: Factor Scores dialogue box, as shown below:
Published with written permission from SPSS Statistics, IBM Corporation.
- Check the Save as variables option and then keep the Regression option selected. You will end up with a screen similar to below:
Published with written permission from SPSS Statistics, IBM Corporation.
- Click on the button. You will be returned to the Factor Analysis dialogue box.
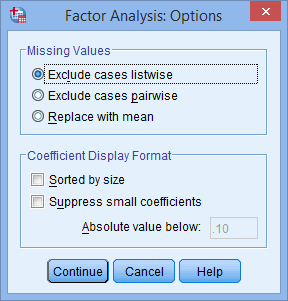
- Click on the button. You will be presented with the Factor Analysis: Options dialogue box, as shown below:
Published with written permission from SPSS Statistics, IBM Corporation.
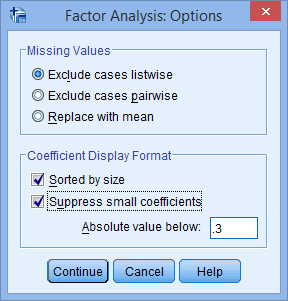
- Check the Sorted by size and Suppress small coefficients option. Change the Absolute value below: from ".10" to ".3". You will end up with a screen similar to below:
Published with written permission from SPSS Statistics, IBM Corporation.
- Click on the button. You will be returned to the Factor Analysis dialogue box.
- Click on the button to generate the output.
SPSS Statistics
Analysing the results of a principal components analysis (PCA)
The output generated by SPSS Statistics is quite extensive and can provide a lot of information about your analysis. However, you will often find that the analysis is not yet complete and you will have to re-run the SPSS Statistics analysis above (possibly more than once) before you get to your final solution. Below we briefly explain the seven steps that you will need to follow to interpret your PCA results, and where required, perform additional analysis in SPSS Statistics. We take you through all these sections step-by-step with SPSS Statistics output in our enhanced PCA guide. You can learn more about our enhanced content on our Features: Overview page. First, take a look through these seven steps:
- Step #1: You need to interpret the results from your assumption tests to make sure that you can use PCA to analyse your data. This includes analysing: (a) the scatterplots that you should have created to check for the linearity of your variables (Assumption #2); (b) sampling adequacy, based on the Kaiser-Meyer-Olkin (KMO) Measure of Sampling Adequacy for the overall data set and the KMO measure for each individual variable (Assumption #3); (c) data suitable for reduction with Bartlett's test of sphericity (Assumption #4); and (d) the standard deviations of components scores to check for significant outliers (Assumption 5).
- Step #2: You need to inspect the initial extraction of components. At this point, there will be as many components as there are variables. You should focus on the Initial Eigenvalues to get an initial sense of the major components you have extracted and how much of the total variance each component explains. However, at this stage, you should not only be aware that you don't have sufficient information to select components, but also that the output produced is based on default options in SPSS Statistics (i.e., you may later have to alter these default options, and then reassess the initial eigenvalues based on the new SPSS Statistics output that is produced).
- Step #3: You need to determine the number of 'meaningful' components that you want to retain. To do this, you have a number of options: (a) use the eigenvalue-one criterion (the SPSS Statistics default); (b) use the proportion of total variance accounted for; (c) use the scree plot test; or (d) use the interpretability criterion. You need to consider why you would use one of these options over another, as well as the implications that these choices might have for the number of components that are extracted. You also have to consider the type of rotation you selected - whether Varimax, Direct Oblimin, Quartimax, Equamax or Promax - and how this will influence how your components 'load' onto different variables. The goal is to achieve a 'simple structure'; that is, a structure where you have a readily explainable division of variables onto separate components, with a component loading onto at least three variables.
- Step #4: If you have not chosen to retain the number of components initially presented by SPSS Statistics (i.e., based on the eigenvalue-one criterion, which is the SPSS Statistics default, mentioned in Step 3), you will need to carry out Forced Factor Extraction using SPSS Statistics. This simply involves a number of additional steps where you instruct SPSS Statistics to retain a specific number of components (i.e., the number of components you have arrived at based on your choices in Step 3 above). You will then have to reanalyse your data accordingly (i.e., SPSS Statistics will provide you with new numbers based on your new criteria).
- Step #5: You need to interpret the final, rotated solution. To do this, you will need to interpret the final (revised) Total Variance Explained output from SPSS Statistics and Rotated Components Matrix.
- Step #6: You are now in a position to report your results. This should include all 'relevant' decisions you made during your analysis (e.g., the criteria you used to extract components, which type of rotation you used, etc.). This is particularly important in PCA because so many subjective judgements are made along the way, all of which could have led to different results from the same data. We show you how to do this, as well as how to report your Rotated Component Matrix scores, in our enhanced guide.
- Step #7: Finally, after you have completed your main analysis, you will often want to assign a score to each component for each participant. For example, based on the example we used in this guide, questions regarding motivation loaded strongly on Component 1, so you might want to have a score that reflects an individual's 'motivation'. You might also want to use these scores for further analyses, such as in multiple regression. We show you two common methods to achieving a score that reflects the variables that are associated with each of your components: component scores and component-based scores.
If you are unsure how to interpret your PCA results, or how to check for linearity, carry out transformations using SPSS Statistics, or conduct additional PCA procedures in SPSS Statistics such as Forced Factor Extraction (see Step #4), we show you how to do this in our enhanced PCA guide. We also show you how to write up the results from your assumptions tests and PCA output if you need to report this in a dissertation/thesis, assignment or research report. We do this using the Harvard and APA styles. You can learn more about our enhanced content on our Features: Overview page.

 Published with written permission from SPSS Statistics, IBM Corporation.