Our enhanced independent t-test guide.
What's included?


- Understand the basics of the independent t-test
Our guides are written using straightforward language, assuming you have little or no knowledge of statistics.
If you are unfamiliar with the basic concepts of the independent t-test, such as the principle of independent groups, the null and alternative hypothesis, effect sizes, sample size considerations, or the types of problems that can be solved with the independent t-test, these are discussed to help you get started.

- Correct data setup in SPSS Statistics
Learning how to quickly and correctly set up your SPSS Statistics file.
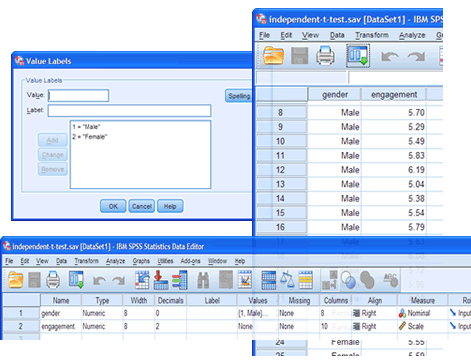
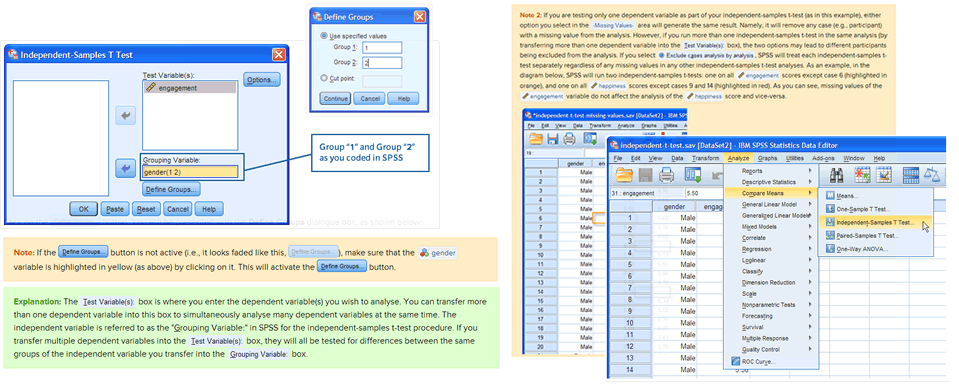
We show you exactly how to name your dependent and independent variables so SPSS Statistics doesn't throw a warning message, what you have to think about when it comes to setting decimals, labels and missing values, as well as the measurement type you used. In case you've never used SPSS Statistics before, we explain what all of these terms mean. With one section of our enhanced independent t-test guide dedicated to data setup, this should take you no more than a few minutes using this guide.
If you are interested more generally in how our enhanced content can help you set up your data for all the statistical tests we cover, learn more on our Features: Data Setup page.

- Test the assumptions of the independent t-test using SPSS Statistics
Make sure that you can use the independent t-test to analyse your data. Check that the assumptions of the test are met.
Assumptions #1, #2 and #3 in the previous "quick start" guide cannot be tested with SPSS Statistics, but we explain these in more detail in the enhanced guide. However, assumptions #4, #5 and #6 can be checked using SPSS Statistics. This is how the enhanced independent t-test guide helps:
Check there are "no significant outliers" in your data that could negatively influence your results.
Not all outliers are bad, but we help you to determine which ones are, and how to deal with these.
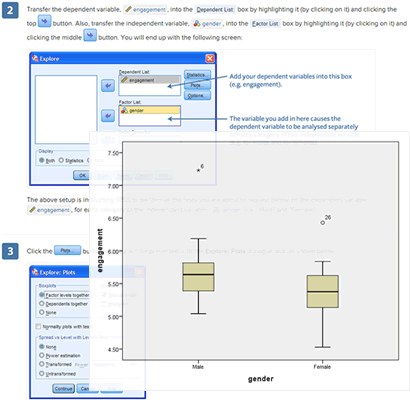
First, we show you how to detect if you have any outliers in either of your two groups. For example, if your independent variable was gender, your two groups would be "males" and "females". This involves 7 steps in SPSS Statistics that you'll need to create two boxplots, one to detect for outliers in the group of "males" and one for the group of "females".
Second, if you have any outliers, we help you to determine why these may exist, and whether they could be problem for your analysis. Remember, not all outliers are bad.
Finally, we explain how you can deal with outliers that could be a problem, providing practical solutions using SPSS Statistics.
Check that your dependent variable is "approximately normally distributed" for each category of your independent variable.
Normally distributed data is a requirement of the independent t-test, but there are solution if your data fails this assumption.
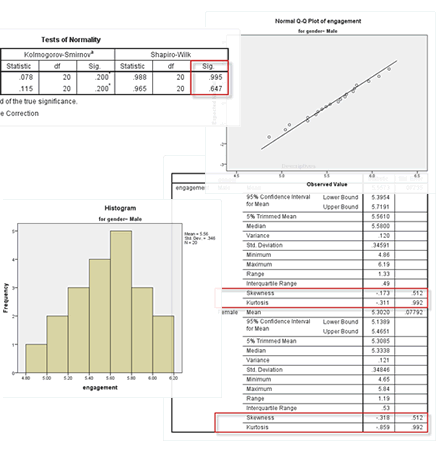
First, we show you how to test for normality in SPSS Statistics using one of four methods: Shapiro-Wilk test of normality, Skewness and Kurtosis, Histograms and Normal Q-Q Plots. However, you only have to use one of these methods, and we explain which method might be most appropriate for your data. The SPSS Statistics procedure to do this is quite simple, but we show you which options to check.
Second, we show you how to interpret your results, irrespective of which of the four methods you used above.
Third, if your data is "not normal" (i.e., it fails this assumption), we explain the options you have, as well as providing practical solutions using SPSS Statistics (e.g., an SPSS Statistics procedure where you can try and "transform" your data to so that it becomes "normal", and therefore, meets this assumption).
Check that there are homogeneity of variances.
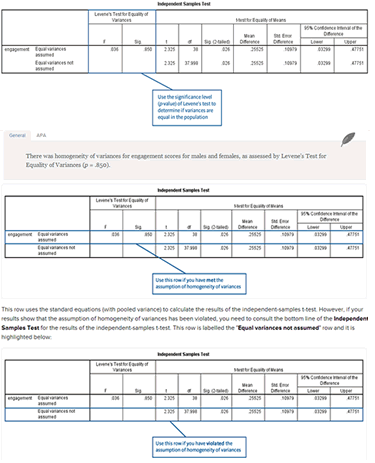
Checking for homogeneity of variances is a very easy procedure in SPSS Statistics. It also requires no extra work if your data fails this assumption. You simply need to interpret the results of your SPSS Statistics output in a different way to when the assumption is met (i.e., SPSS Statistics produces output showing what the result of your independent t-test would be if this assumption is met or violated).
We show you the SPSS Statistics procedure to check for homogeneity of variances, as well as how to interpret the results from your independent t-test based on whether this assumption is met or violated.
If you are interested more generally in how our enhanced content can help you test for the assumptions of all the statistical tests we cover, learn more on our Features: Assumptions page.

- Carrying out the independent t-test procedure using SPSS Statistics
Don't miss a step when analysing your data using SPSS Statistics. Use our comprehensive, step-by-step guides.
We guide you through all the required steps in SPSS Statistics to not only enter your data correctly, and test the assumptions of the independent t-test, but also carry out the independent t-test itself (i.e., there are separate steps in SPSS Statistics to test for the assumptions of the independent t-test, and for carrying out the independent t-test on your data). The enhanced independent t-test includes step-by-step instructions, large screenshots, as well as tips and notes that will help you understand what is happening to your data along the way. In case you want to practice these steps in SPSS Statistics before analysing your own data, you can download the SPSS Statistics file of the example we use to take you through the assumptions tests and the main independent t-test procedure.
If you are interested more generally in how our enhanced content can help you carry out the SPSS Statistics procedures of all the statistical tests we cover, learn more on our Features: SPSS Procedure page.

- Interpret SPSS Statistics output
Understand what the statistics mean. Report your findings with confidence.
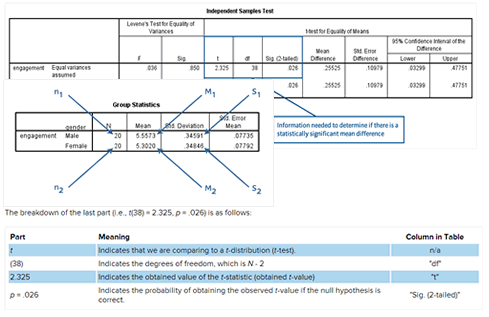
We tell you which parts of the tables that SPSS Statistics produces are relevant and which you can ignore. This involves interpreting and reporting the mean difference, standard error of the mean difference, 95% confidence intervals, degrees of freedom, t value and p value. We illustrate the output using examples, explaining how to understand results that are statistically significant, as well as those that were not.
We explain the output that SPSS Statistics produces using straightforward, jargon-free language, assuming that you have little or no knowledge of statistics. The purpose of our enhanced independent t-test guide is to ensure that you can interpret your own results.

- Writing up your results
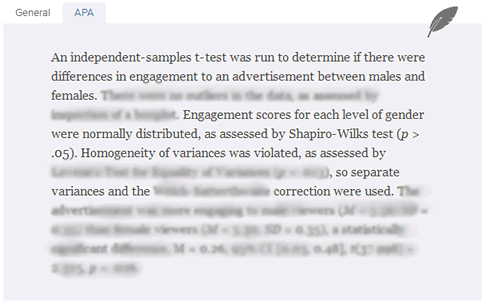
When it comes to finally writing up your results, we show you how to do this using an appropriate reporting style (i.e., the APA style or a general reporting style). We also show you how to write up the results from your assumptions tests. As you work through the various assumptions tests and SPSS Statistics procedures required to carry out a statistical test, we show you how to accurately write up each part of your output. At the end of each guide, we show you how you can bring together all your results into a single results statement.
If you are interested more generally in how our enhanced content can help you interpret and write up the output for all the statistical tests we cover, learn more on our Features: Writing up page.
BACK TO TOP