Standard Score (cont...)
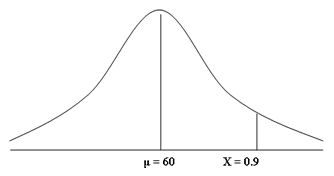
To answer this question, we need to find the mark (which we call "X") on our frequency distribution that reflects the top 10% of marks. Since the mean score was 60 out of 100, we immediately know that the mark will be greater than 60. After all, if we refer to our frequency distribution below, we are interested in the area to the right of the mean score of 60 that reflects the top 10% of marks (shaded in red). As a decimal, the top 10% of marks would be those marks above 0.9 (i.e., 100% - 90% = 10% or 1 - 0.9 = 0.1).
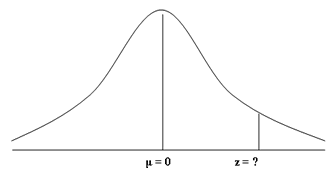
First, we should convert our frequency distribution into a standard normal distribution as discussed in the opening paragraphs of this guide. As such, our mean score of 60 becomes 0 and the score (X) we are looking for, 0.9, becomes our z-score, which is currently unknown. Note the changes to the labelling of the x-axis.
The next step involves finding out the value for our z-score. To do this, we refer back to the standard normal distribution table.
In answering the first question in this guide, we already knew the z-score, 0.67, which we used to find the appropriate percentage (or number) of students that scored higher than Sarah, 0.2514 (i.e., 25.14% or roughly 25 students achieve a higher mark than Sarah). Using the z-score, 0.67, and the y-axis and x-axis of the standard normal distribution table, this guided us to the appropriate value, 0.2514. In this case, we need to do the exact reverse to find our z-score.
We know the percentage we are trying to find, the top 10% of students, corresponds to 0.9. As such, we first need to find the value 0.9 in standard normal distribution table. When looking at the table, you may notice that the closest value to 0.9 is 0.8997. If we take the 0.8997 value as our starting point and then follow this row across to the left, we are presented with the first part of the z-score. You will notice that the value on the y-axis for 0.8997 is 1.2. We now need to do the same for the x-axis, using the 0.8997 value as our starting point and following the column up. This time, the value on the x-axis for 0.8997 is 0.08. This forms the second part of the z-score. Putting these two values together, the z-score for 0.8997 is 1.28 (i.e., 1.2 + 0.08 = 1.28).
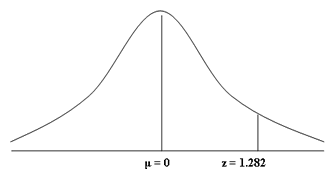
There is only one problem with this z-score; that is, it is based on a value of 0.8997 rather than the 0.9 value we are interested in. This is one of the difficulties of refer to the standard normal distribution table because it cannot give every possible z-score value (that we require a quite enormous table!). Therefore, you can either take the closest two values, 0.8997 and 0.9015, to your desired value, 0.9, which reflect the z-scores of 1.28 and 1.29, and then calculate the exact value of "z" for 0.9, or you can use a z-score calculator. If we use a z-score calculator, our value of 0.9 corresponds with a z-score of 1.282. In other words, P ( z > 1.282 ) = 0.1.
Now that we have the key information (that is, the mean score, µ, the standard deviation, s , and z-score, z), we can answer our question directly, namely: What mark would a student have to achieve to be in the top 10% of the class and qualify for the advanced English Literature class? First, let us reiterate the facts:
| Score |
Mean |
Standard Deviation |
z-score |
| (X) |
µ |
s |
z |
| ? |
60 |
15 |
1.282 |
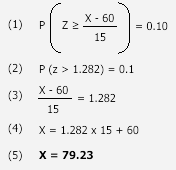
To find out the relevant score, we apply the following formula:
Therefore, students that scored above 79.23 marks out of 100 came in the top 10% of the English Literature class, qualifying for the advanced English Literature class as a result.
Setting the Scene: Part II
Clearly, the z-score statistic is helpful in highlighting how Sarah performed in her English Literature coursework and what mark a student would have to achieve to be in the top 10% of the class and qualify for the advanced English Literature class. However, we have only been talking about one distribution here, namely the distribution of scores amongst 50 students that completed a piece of English Literature coursework. What if Sarah wanted to compare how well she performed in her Maths coursework compared with her English Literature coursework?
In this case, Sarah achieved a higher mark in her Maths coursework, 72 out of 100. However, as we have already learnt, just because her Maths score (72) is higher than her English Literature score (70), we shouldn't assume that she performed better in her Maths coursework compared to her English Literature coursework. The question therefore arises: How well did Sarah perform in her Maths coursework compared to her English Literature coursework?


