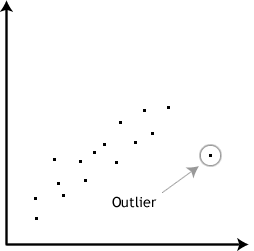
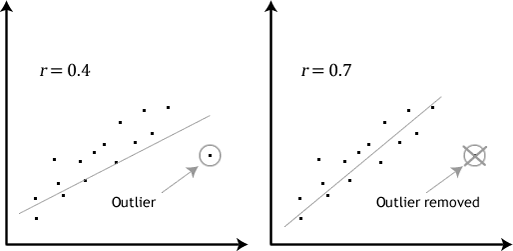
Can you establish cause-and-effect?
No, the Pearson correlation cannot determine a cause-and-effect relationship. It can only establish the strength of linear association between two variables. As stated earlier, it does not even distinguish between independent and dependent variables.
How do I report the output of a Pearson product-moment correlation?
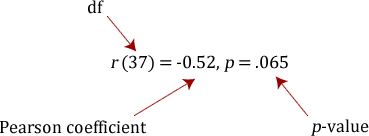
You need to state that you used the Pearson product-moment correlation and report the value of the correlation coefficient, r, as well as the degrees of freedom (df). You should express the result as follows:

where the degrees of freedom (df) is the number of data points minus 2 (N – 2). If you have not tested the significance of the correlation then leave out the degrees of freedom and p-value such that you would simply report: r = -0.52.
Can I determine whether the association is statistically significant?
Yes, the easy way to do this is through a statistical programme, such as SPSS Statistics. To learn how to run a Pearson correlation in SPSS Statistics, go to our guide: Pearson's correlation in SPSS Statistics. You need to be careful how you interpret the statistical significance of a correlation. If your correlation coefficient has been determined to be statistically significant this does not mean that you have a strong association. It simply tests the null hypothesis that there is no relationship. By rejecting the null hypothesis, you accept the alternative hypothesis that states that there is a relationship, but with no information about the strength of the relationship or its importance.
What is the Coefficient of Determination?
The coefficient of determination, r2, is the square of the Pearson correlation coefficient r (i.e., r2). So, for example, a Pearson correlation coefficient of 0.6 would result in a coefficient of determination of 0.36, (i.e., r2 = 0.6 x 0.6 = 0.36). The coefficient of determination, with respect to correlation, is the proportion of the variance that is shared by both variables. It gives a measure of the amount of variation that can be explained by the model (the correlation is the model). It is sometimes expressed as a percentage (e.g., 36% instead of 0.36) when we discuss the proportion of variance explained by the correlation. However, you should not write r2 = 36%, or any other percentage. You should write it as a proportion (e.g., r2 = 0.36).
To learn how to run a Pearson correlation in SPSS Statistics, go to our guide: Pearson's correlation in SPSS Statistics.
Bibliography and Referencing
Please see the list below:
| Book | Cohen, J. (1988). Statistical power analysis for the behavioral sciences (2nd ed.). New York: Psychology Press. |
| Book | Cohen, B. H. (2013). Explaining psychological statistics (4th ed.). Hoboken, NJ: John Wiley & Sons. |
| Journal Article | Edgell, S. E., & Noon. S. M. (1984). Effect of violation of normality on the t test of the correlation coefficient. Psychological Bulletin, 95(3), 576-583. |
| Book | Hogg, R. V., McKean, J., & Craig, A. T. (2014). Introduction to mathematical statistics (7th. ed.). Harlow, Essex: Pearson Education. |
| Book | Lindeman, R. H., Merenda, P. F., & Gold, R. Z. (1980). Introduction to bivariate and multivariate analysis. Glenview, IL: Scott, Foresman and Company. |
| Book |
Nunnally, J. C. (1978). Psychometric theory (2nd ed.). New York: McGraw-Hill Book Company. |
| Journal Article | Pearson, K. (1895). Contributions to the mathematical theory of evolution. Psychological transactions of the Royal Society of London A, 186, 343-414. |
| Journal Article | Pearson, K. (1920). Notes on the history of correlations. Biometrika, 13, 25-45. |
| Book | Shevlyakov, G. L., & Oja, H. (2016). Robust correlation: Theory and applications. Chichester, West Sussex: John Wiley & Sons. |
| Book | Wilcox, R. (2012). Introduction to robust estimation and hypothesis testing (3rd ed.). Oxford: Academic Press. |
Reference this article
Laerd Statistics (2020). Pearson's product moment correlation. Statistical tutorials and software guides. Retrieved Month, Day, Year, from https://statistics.laerd.com/statistical-guides/pearson-correlation-coefficient-statistical-guide.php
For example, if you viewed this guide on 29th April 2020, you would use the following reference:
Laerd Statistics (2020). Pearson's product moment correlation. Statistical tutorials and software guides. Retrieved April, 29, 2020, from https://statistics.laerd.com/statistical-guides/pearson-correlation-coefficient-statistical-guide.php