One-way ANOVA (cont...)
When might you need to use this test? (cont...)
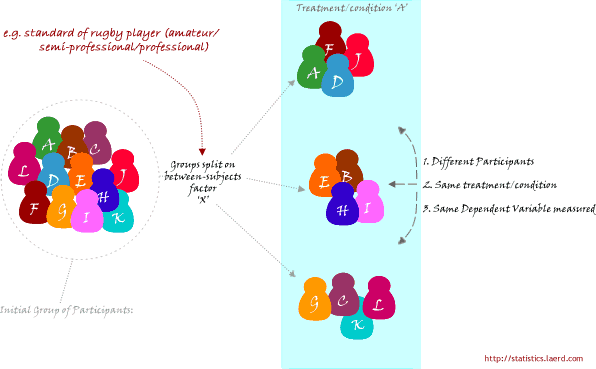
A second study design is to recruit a group of individuals and then split them into groups based on some independent variable. Again, each individual will be assigned to one group only. This independent variable is sometimes called an attribute independent variable because you are splitting the group based on some attribute that they possess (e.g., their level of education; every individual has a level of education, even if it is "none"). Each group is then measured on the same dependent variable having undergone the same task or condition (or none at all). For example, a researcher is interested in determining whether there are differences in leg strength between amateur, semi-professional and professional rugby players. The force/strength measured on an isokinetic machine is the dependent variable. This type of study design is illustrated schematically in the Figure below:
Why not compare groups with multiple t-tests?
Every time you conduct a t-test there is a chance that you will make a Type I error. This error is usually 5%. By running two t-tests on the same data you will have increased your chance of "making a mistake" to 10%. The formula for determining the new error rate for multiple t-tests is not as simple as multiplying 5% by the number of tests. However, if you are only making a few multiple comparisons, the results are very similar if you do. As such, three t-tests would be 15% (actually, 14.3%) and so on. These are unacceptable errors. An ANOVA controls for these errors so that the Type I error remains at 5% and you can be more confident that any statistically significant result you find is not just running lots of tests. See our guide on hypothesis testing for more information on Type I errors.