Wilcoxon Signed-Rank Test using SPSS Statistics
Introduction
The Wilcoxon signed-rank test is the nonparametric test equivalent to the dependent t-test. As the Wilcoxon signed-rank test does not assume normality in the data, it can be used when this assumption has been violated and the use of the dependent t-test is inappropriate. It is used to compare two sets of scores that come from the same participants. This can occur when we wish to investigate any change in scores from one time point to another, or when individuals are subjected to more than one condition.
For example, you could use a Wilcoxon signed-rank test to understand whether there was a difference in smokers' daily cigarette consumption before and after a 6 week hypnotherapy programme (i.e., your dependent variable would be "daily cigarette consumption", and your two related groups would be the cigarette consumption values "before" and "after" the hypnotherapy programme). You could also use a Wilcoxon signed-rank test to understand whether there was a difference in reaction times under two different lighting conditions (i.e., your dependent variable would be "reaction time", measured in milliseconds, and your two related groups would be reaction times in a room using "blue light" versus "red light").
This "quick start" guide shows you how to carry out a Wilcoxon signed-rank test using SPSS Statistics, as well as interpret and report the results from this test. However, before we introduce you to this procedure, you need to understand the different assumptions that your data must meet in order for a Wilcoxon signed-rank test to give you a valid result. We discuss these assumptions next.
SPSS Statistics
Assumptions of the Wilcoxon signed-rank test
When you choose to analyse your data using a Wilcoxon signed-rank test, part of the process involves checking to make sure that the data you want to analyse can actually be analysed using a Wilcoxon signed-rank test. You need to do this because it is only appropriate to use a Wilcoxon signed-rank test if your data "passes" three assumptions that are required for a Wilcoxon signed-rank test to give you a valid result. The first two assumptions relate to your study design and the types of variables you measured. The third assumption reflects the nature of your data and is the one assumption you test using SPSS Statistics. These three assumptions as briefly explained below:
- Assumption #1: Your dependent variable should be measured at the ordinal or continuous level. Examples of ordinal variables include Likert items (e.g., a 7-point item from "strongly agree" through to "strongly disagree"), amongst other ways of ranking categories (e.g., a 5-point item explaining how much a customer liked a product, ranging from "Not very much" to "Yes, a lot"). Examples of continuous variables (i.e., interval or ratio variables) include revision time (measured in hours), intelligence (measured using IQ score), exam performance (measured from 0 to 100), weight (measured in kg), and so forth. You can learn more about ordinal and continuous variables in our article: Types of Variable.
- Assumption #2: Your independent variable should consist of two categorical, "related groups" or "matched pairs". "Related groups" indicates that the same subjects are present in both groups. The reason that it is possible to have the same subjects in each group is because each subject has been measured on two occasions on the same dependent variable. For example, you might have measured 10 individuals' performance in a spelling test (the dependent variable) before and after they underwent a new form of computerized teaching method to improve spelling. You would like to know if the computer training improved their spelling performance. The first related group consists of the subjects at the beginning (prior to) the computerized spelling training and the second related group consists of the same subjects, but now at the end of the computerized training. The Wilcoxon signed-rank test can also be used to compare different subjects within a "matched-pairs" study design, but this does not happen very often. Nonetheless, to learn more about the different study designs you use with a Wilcoxon signed-rank test, see our enhanced Wilcoxon signed-rank test guide.
- Assumption #3: The distribution of the differences between the two related groups (i.e., the distribution of differences between the scores of both groups of the independent variable; for example, the reaction time in a room with "blue lighting" and a room with "red lighting") needs to be symmetrical in shape. If the distribution of differences is symmetrically shaped, you can analyse your study using the Wilcoxon signed-rank test. In practice, checking for this assumption just adds a little bit more time to your analysis, requiring you to click a few more buttons in SPSS Statistics when performing your analysis, as well as think a little bit more about your data, but it is not a difficult task. However, do not be surprised if, when analysing your own data using SPSS Statistics, this assumption is violated (i.e., is not met). This is not uncommon when working with real-world data rather than textbook examples, which often only show you how to carry out a Wilcoxon signed-rank test when everything goes well! However, even when your data fails this assumption, there is often a solution to overcome this, such as transforming your data to achieve a symmetrically-shaped distribution of differences (not a preferred option) or running a sign test instead of the Wilcoxon signed-rank test. If you are unsure of the procedures in SPSS Statistics to test this assumption or how to interpret the SPSS Statistics output, we show you how in our enhanced Wilcoxon signed-rank test guide, which you can access by subscribing to Laerd Statistics.
In the section, Test Procedure in SPSS Statistics, we illustrate the SPSS Statistics procedure to perform a Wilcoxon signed-rank test. First, we introduce the example that is used in this "quick start" guide.
SPSS Statistics
Example used in this guide
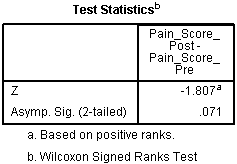
A pain researcher is interested in finding methods to reduce lower back pain in individuals without having to use drugs. The researcher thinks that having acupuncture in the lower back might reduce back pain. To investigate this, the researcher recruits 25 participants to their study. At the beginning of the study, the researcher asks the participants to rate their back pain on a scale of 1 to 10, with 10 indicating the greatest level of pain. After 4 weeks of twice weekly acupuncture, the participants are asked again to indicate their level of back pain on a scale of 1 to 10, with 10 indicating the greatest level of pain. The researcher wishes to understand whether the participants' pain levels changed after they had undergone the acupuncture, so a Wilcoxon signed-rank test is run.
In our enhanced Wilcoxon signed-rank test guide, we show you how to correctly enter data in SPSS Statistics to run a Wilcoxon signed-rank test. You can learn about our enhanced data setup content on our Features: Data Setup page. Alternately, see our generic, "quick start" guide: Entering Data in SPSS Statistics. In our enhanced Wilcoxon signed-rank test guide, we also explain how to deal with missing values in your data set (e.g., if a participant completed a pre-test, but failed to turn up to the post-test). In the next section, we take you through the Wilcoxon signed-rank test procedure using SPSS Statistics.

