Sign Test using SPSS Statistics
Introduction
The "paired-samples sign test", typically referred to as just the "sign test", is used to determine whether there is a median difference between paired or matched observations. The test can be considered as an alternative to the dependent t-test (also called the paired-samples t-test) or Wilcoxon signed-rank test when the distribution of differences between paired observations is neither normal nor symmetrical, respectively. Most commonly, participants are tested at two time points or under two different conditions on the same continuous dependent variable. However, two different groups of participants are possible as part of a "matched-pairs" study design.
For example, you could use the sign test to understand whether there was a median difference in smokers' daily cigarette consumption before and after a 6-week hypnotherapy programme (i.e., your dependent variable would be "daily cigarette consumption", with the two time points being "before" and "after" the hypnotherapy programme). You could also use the sign test to determine whether there was a median difference in reaction times under two different lighting conditions (i.e., your dependent variable would be "reaction time", measured in milliseconds, and the two conditions would be testing reaction time in a room using "blue light" and a room using "red light").
This "quick start" guide shows you how to carry out a sign test using SPSS Statistics, as well as interpret and report the results from this test. However, before we introduce you to this procedure, you need to understand the different assumptions that your data must meet in order for a sign test to give you a valid result. We discuss these assumptions next.
SPSS Statistics
Assumptions of the sign test
When you choose to analyse your data using a sign test, part of the process involves checking to make sure that the data you want to analyse can actually be analysed using a sign test. You need to do this because it is only appropriate to use a sign test if your data "passes" four assumptions that are required for a sign test to give you a valid result. You cannot test these assumptions with SPSS Statistics because they relate to your study design and choice of variables. However, you should check whether your study meets these four assumptions before moving on. If these assumptions are not met, there is likely to be a different statistical test that you can use instead. These four assumptions are explained below:
- Assumption #1: Your dependent variable should be measured on a continuous (i.e., interval or ratio) or ordinal level. Examples of continuous variables include weight (measured in kilograms), temperature (measured in °C), salary (measured in US dollars), revision time (measured in hours), intelligence (measured using IQ score), speed (measured in mph), exam performance (measured from 0 to 100), sales (measured in US dollars), and so forth. Examples of ordinal variables include Likert items (e.g., a 7-point scale from strongly agree through to strongly disagree), physical activity level (e.g., 4 groups: sedentary, low, moderate and high), customers liking a product (ranging from "Not very much", to "It is OK", to "Yes, a lot"), the pain felt by patients after hip replacement surgery (e.g., "No pain", "Mild pain", "Moderate pain", "Strong pain" and "Severe pain"), amongst other ways of ranking categories (e.g., a 5-point scale explaining how much a customer liked a product, ranging from "Not very much" to "Yes, a lot"). If you are unsure whether your dependent variable is continuous or ordinal, see our Types of Variable guide.
- Assumption #2: Your independent variable should consist of two categorical, "related groups" or "matched pairs". "Related groups" indicates that the same subjects are present in both groups. The reason that it is possible to have the same subjects in each group is because each subject has been measured on two occasions on the same dependent variable. For example, you might have measured 100 participants' salary in US dollars (i.e., the dependent variable) before and after they took an MBA to improve their employability and salary (i.e., the two "time points" where participants' salary was measured – "before" and "after" the MBA course – reflect the two "related groups" of the independent variable). Since the same participants were measured at these two time points, the groups are related. It is also common for related groups to reflect two different conditions that all participants undergo (i.e., these conditions are sometimes called interventions, treatments or trials). For example, 30 participants undergo a hypnotherapy programme (condition A) and drug programme (condition B) to determine which is more effective (if any) at treating depression.
- Assumption #3: The paired observations for each participant need to be independent. That is, one participant's values cannot influence another participant's values.
- Assumption #4: The difference scores (i.e., differences between the paired observations) are from a continuous distribution. The hazard of breaking this assumption is that there might not be a unique median.
If your study design and data meets these four assumptions, you can run the SPSS Statistics procedure for the sign test, which we illustrate in the Test Procedure in SPSS Statistics section. First, we set out the example we use to explain the sign test procedure in SPSS Statistics.
SPSS Statistics
Example used in this guide
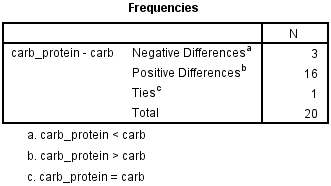
A researcher wants to test a new formula for a sports drink that improves running performance. Instead of a regular, carbohydrate-only drink, this new sports drink contains a new carbohydrate-protein mixture. The researcher would like to know whether this new carbohydrate-protein drink leads to a difference in performance compared to the carbohydrate-only sports drink. To do this, the researcher recruited 20 participants who each performed two trials in which they had to run as far as possible in two hours on a treadmill. In one of the trials they drank the carbohydrate-only drink and in the other trial they drank the carbohydrate-protein drink. The order of the trials was counterbalanced and the distance they ran in both trials was recorded.
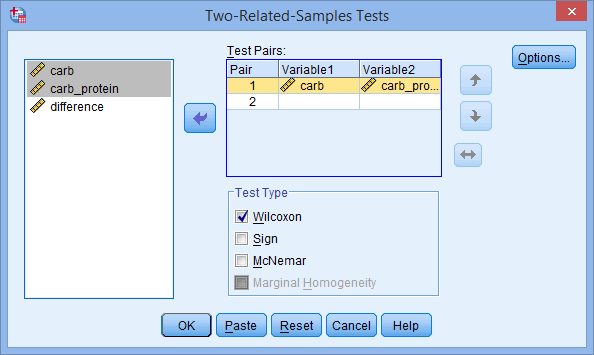
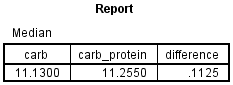
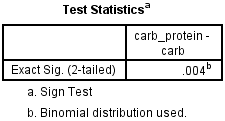
Therefore, for a sign test, you will have two variables. In this example, these are: (1) carb, which is the distance run (in km) in two hours for the carbohydrate-only trial; and (2) carb_protein, which is the distance run (in km) in two hours for the carbohydrate-protein trial. The researcher would like to determine whether there was a difference in the distance run between the two trials, and therefore, if there is a performance difference between the two different sports drinks. In variable terms, the researcher wants to know if the median of the differences between the carb and carb_protein scores is 0 (zero).
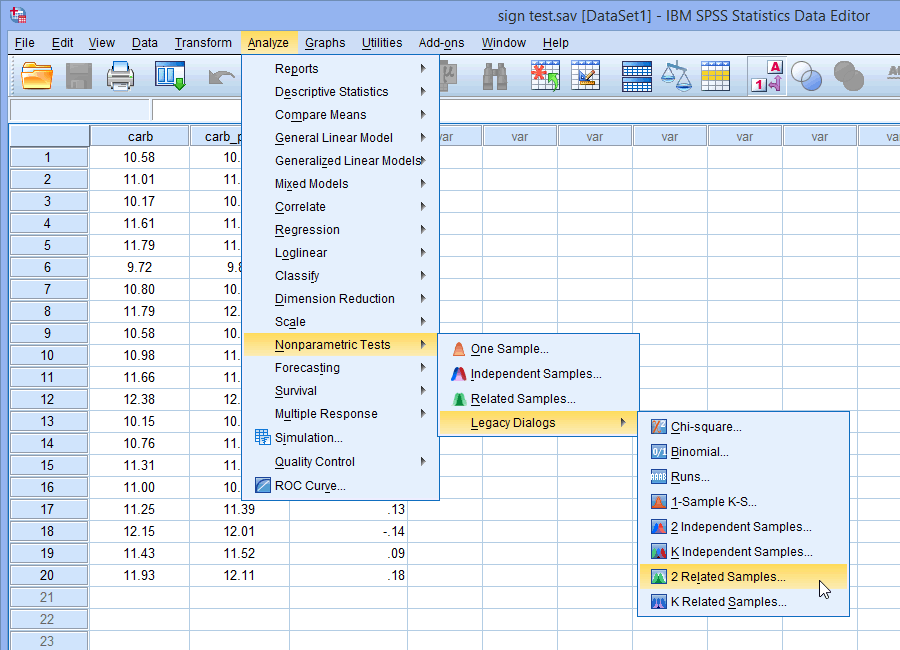
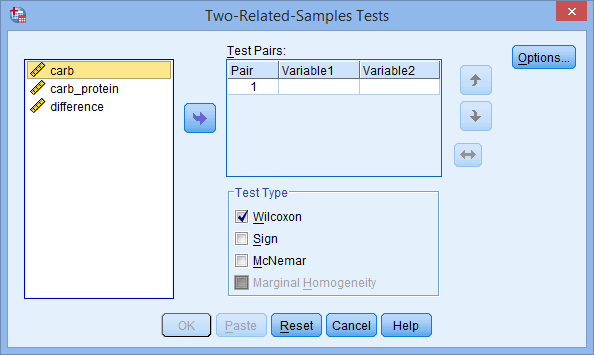
In our enhanced sign test guide, we show you how to correctly enter data in SPSS Statistics to run a sign test. You can learn about our enhanced data setup content on our Features: Data Setup page or access the enhanced sign test guide by subscribing to Laerd Statistics. In the next section, we take you through the sign test procedure using SPSS Statistics.