Somers' d using SPSS Statistics
Introduction
Somers' delta (or Somers' d, for short), is a nonparametric measure of the strength and direction of association that exists between an ordinal dependent variable and an ordinal independent variable. Whilst it is possible to analyse the association between two ordinal variables using Goodman and Kruskal's gamma, Somers' d is appropriate when you want to distinguish between a dependent and independent variable (i.e., since Goodman and Kruskal's gamma does not make any distinction between the two ordinal variables).
For example, you could use Somers' d to understand whether there is an association between marathon running times and training volume (i.e., the ordinal dependent variable is "marathon running time", split into six groups – 2:30-2:59 hours, 3:00-3:29 hours, 3:30-3:59 hours, 4:00-4:29 hours, 4:30-4:59 hours and 5:00-5:29 hours – and the ordinal independent variable is "training volume", split into five groups: "0-4 hours per week", "5-9 hours per week", "10-14 hours per week", "15-19 hours per week" and "20-24 hours per week"). Alternately, you could use Somers' d to understand whether there is an association between customer satisfaction and hotel room cleanliness (i.e., the ordinal dependent variable is "customer satisfaction", measured on a five point scale from "very satisfied" to "very dissatisfied", and the ordinal independent variable is "hotel room cleanliness", measured on a three point scale from "above average" to "below average").
This "quick start" guide shows you how to carry out Somers' d using SPSS Statistics. We show you the main procedure to carry out Somers' d in the Procedure section. First, we introduce you to the assumptions that you must consider when carrying out Somers' d.
SPSS Statistics
Assumptions of Somers' d
When you choose to analyse your data using Somers' d, part of the process involves checking to make sure that the data you want to analyse can actually be analysed using Somers' d. You need to do this because it is only appropriate to use Somers' d if your data "passes" two assumptions that are required for Somers' d to give you a valid result. In practice, checking for these two assumptions just adds a little bit more time to your analysis, requiring you to click of few more buttons in SPSS Statistics when performing your analysis, as well as think a little bit more about your data, but it is not a difficult task. These two assumptions are:
- Assumption #1: You have one dependent variable and one independent variable and both are measured on an ordinal scale. Examples of ordinal variables include Likert scales (e.g., a 7-point scale from "strongly agree" through to "strongly disagree"), amongst other ways of ranking categories (e.g., a 5-point scale explaining how much a customer liked a product, ranging from "Not very much" to "Yes, a lot"). You can learn more about ordinal variables in our article: Types of Variable.
- Assumption #2: There needs to be a monotonic relationship between the dependent and independent variable. A monotonic relationship exists when either the variables increase in value together, or as one variable value increases, the other variable value decreases. It is typically not possible to check this assumption when running a Somers' d analysis.
If your data fail to meet these assumptions, you should consider using a different statistical test, which we show you how to do in our Statistical Test Selector (N.B., this is part of our enhanced content).
In the section, Test Procedure in SPSS Statistics, we illustrate the SPSS Statistics procedure to perform Somers' d assuming that no assumptions have been violated. First, we set out the example we use to explain the Somers' d procedure in SPSS Statistics.
SPSS Statistics
Example used in this guide
A hotel chain owner wants to determine if there is an association between the cleanliness of a hotel room and customer satisfaction. As such, a total of 189 hotel customers were randomly sampled from all customers staying one night in a large hotel chain. At the end of their stay, the customers were asked to complete a questionnaire with two questions: (1) How satisfied were you with your stay?; and (2) How would you rate the cleanliness of your hotel room?
For question (1), customers were asked to rate their level of satisfaction based on five categories: "very dissatisfied", "moderately dissatisfied", "neither dissatisfied nor satisfied", "moderately satisfied" or "very satisfied". For question (2), customers were asked to rate the cleanliness of their hotel room using a three point scale: "below average", "average" or "above average". These ordered responses reflected the categories of our ordinal dependent variable, customer_satisfaction, and our ordinal independent variable, hotel_room_cleanliness.
Therefore, in the Variable View of SPSS Statistics two ordinal variables were created so that the data collected could be entered: customer_satisfaction and hotel_room_cleanliness. Next, the data from the 189 participants was entered into the Data View of SPSS Statistics.
SPSS Statistics
Data setup in SPSS Statistics to carry out a Somers' d
For a Somers' d, you will have either two or three variables:
(1) An ordinal dependent variable (e.g., customer_satisfaction, which has five categories: "very dissatisfied", "moderately dissatisfied", "neither dissatisfied nor satisfied", "moderately satisfied" and "very satisfied");
(2) An ordinal independent variable, (e.g., hotel_room_cleanliness, which has three categories: "below average", "average" and "above average").
(3) The frequencies (i.e., total counts) for the two ordinal variables above (i.e., the number of participants for each cell combination). This is captured in the variable, freq.
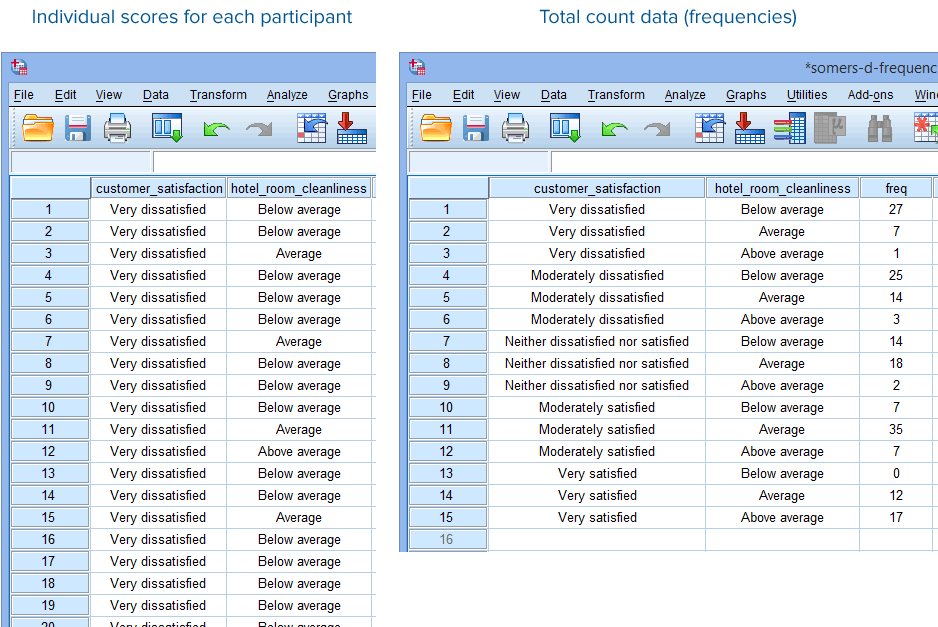
In the diagram below, we show you how you would have set up your data in the Data View of SPSS Statistics if you had entered your data using: (a) the individual scores for each participant (shown in the diagram on the left below), where you only have two variables; or (b) total count data, also known as frequencies (shown in the diagram on the right below), where you have three variables.

Published with written permission from SPSS Statistics, IBM Corporation.
If you are unsure how to correctly enter these variables into the Variable View and Data View of SPSS so that you can carry out your analysis, we show you how in our enhanced Somers' d guide. Just remember that if you have entered your data using total count data (i.e., frequencies), shown in the diagram on the right above, you will also have to weight your cases before you can analyse your data (i.e., this is an additional procedure in SPSS Statistics). You can learn about our enhanced data setup content in general on our Features: Data Setup page or subscribe to Laerd Statistics to access our enhanced Somers' d guide.
SPSS Statistics
SPSS Statistics procedure to carry out a Somers' d
The six steps below show you how to analyse your data using Somers' d in SPSS Statistics when neither of the two assumptions in the previous section, Assumptions, have been violated. At the end of these six steps, we show you how to interpret the results from this test.
Note: The procedure that follows is identical for SPSS Statistics versions 17 to 30, as well as the subscription version of SPSS Statistics, with version 30 and the subscription version being the latest versions of SPSS Statistics. However, in version 27 and the subscription version, SPSS Statistics introduced a new look to their interface called "SPSS Light", replacing the previous look for versions 26 and earlier versions, which was called "SPSS Standard". Therefore, if you have SPSS Statistics versions 27 to 30 (or the subscription version of SPSS Statistics), the images that follow will be light grey rather than blue. However, the procedure is identical.
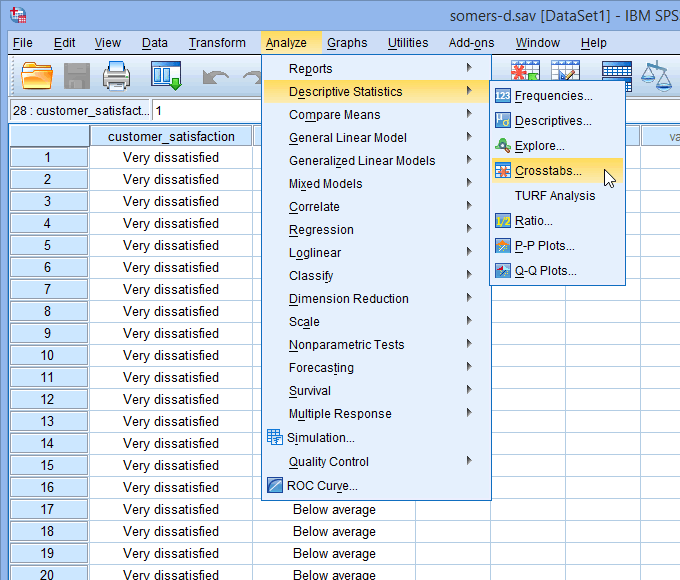
- Click Analyze > Descriptive Statistics > Crosstabs... on the top menu, as shown below:
Published with written permission from SPSS Statistics, IBM Corporation.
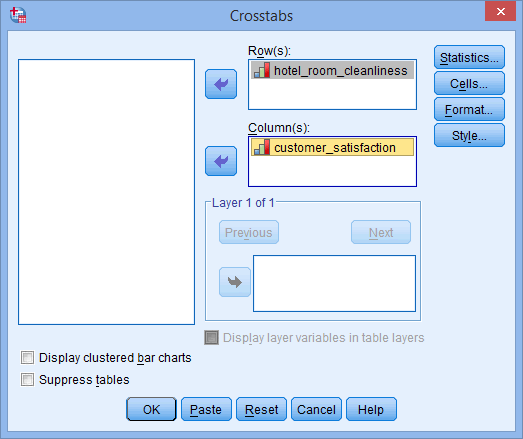
You will be presented with the Crosstabs dialogue box, as shown below:
Published with written permission from SPSS Statistics, IBM Corporation.
- Transfer the ordinal independent variable, hotel_room_cleanliness, into the Row(s): box, and the ordinal dependent variable, customer_satisfaction, into the Column(s): box, by dragging-and-dropping or by clicking on the relevant buttons. You will end up with a screen similar to the one below:
Published with written permission from SPSS Statistics, IBM Corporation.
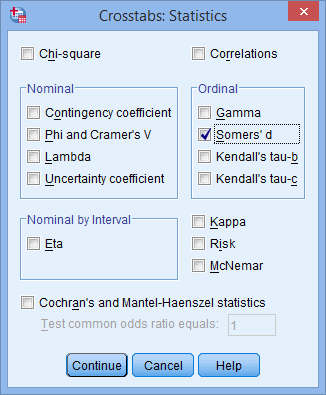
- Click on the button. You will be presented with the following Crosstabs: Statistics dialogue box:
Published with written permission from SPSS Statistics, IBM Corporation.
- Select the Somers' d tick box in the –Ordinal– area, as shown below:
Published with written permission from SPSS Statistics, IBM Corporation.
- Click on the button.
- Click on the button. This will generate the results.
SPSS Statistics
Interpreting the SPSS Statistics output for Somers' d
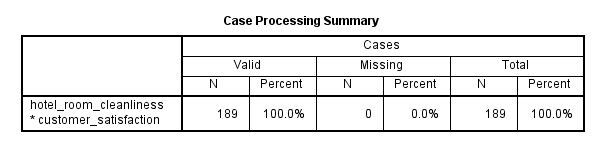
SPSS Statistics generates three main tables for the Somers' d procedure that you ran in the previous section. In this "quick start" guide we focus on the results from the Somers' d procedure only, assuming that your data met all the assumptions of this test. Therefore, when running the Somers' d procedure, start with the Case Processing Summary table:
Published with written permission from SPSS Statistics, IBM Corporation.
The Case Processing Summary table provides a useful check of your data to determine the valid sample size, N, and whether you have any missing data. In our example, there were 189 participants with no missing data.
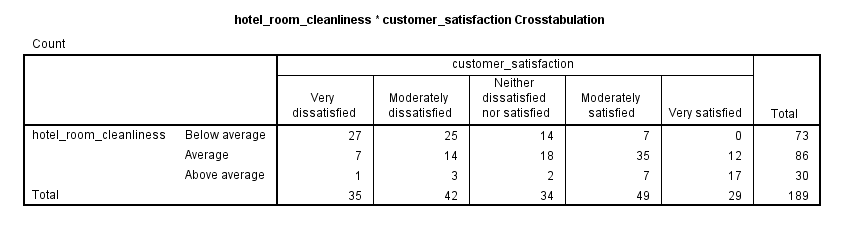
Next, you should get a 'feel' for your data using the table showing the crosstabulation of the data (this will be labelled based on your two variables; in our case, the hotel_room_cleanliness * customer_satisfaction Crosstabulation table), as shown below:
Published with written permission from SPSS Statistics, IBM Corporation.
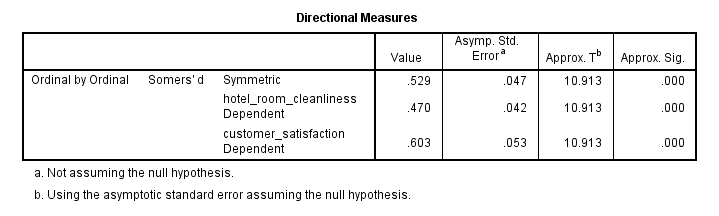
You can use this table to provide descriptive statistics, possibly presented in a table format, so that any readers of your work can understand (and replicate or extend) your results. Finally, you should consult the Directional Measures table, which provides the result of Somers' d, as shown below:
Published with written permission from SPSS Statistics, IBM Corporation.
Somers' d is presented in the "customer_satisfaction Dependent" row of the "Value" column and is .603 in this example. This indicates that increased hotel room cleanliness is associated with increased customer satisfaction. Furthermore, the "Approx. Sig." column shows that the statistical significance value (i.e., p-value) is .000, which means p < .0005. Therefore, the association between the ordinal dependent variable, "customer satisfaction", and ordinal independent variable, "hotel room cleanliness", is statistically significant.
SPSS Statistics
Reporting the results for Somers' d
In our example, you might present the results as follows:
Somers' d was run to determine the association between customer satisfaction and hotel room cleanliness amongst 189 participants. There was a strong, positive correlation between customer satisfaction and hotel room cleanliness, which was statistically significant (d = .603, p < .0005).
In our enhanced Somers' d guide, we show you how to report your results using the Harvard and APA styles, as well as illustrating how to display your results in a clustered bar chart. You can learn more about our enhanced content on our Features: Overview.