Goodman and Kruskal's gamma using SPSS Statistics
Introduction
Goodman and Kruskal's γ (G or γ) is also referred to as Goodman and Kruskal's gamma. It is a nonparametric measure of the strength and direction of association that exists between two variables measured on an ordinal scale (Goodman & Kruskal, 1954). While it is possible to analyse such data using Spearman's rank-order correlation or Kendall's tau-b, Goodman and Kruskal's gamma is recommended when your data has many tied ranks (Siegel & Castellan, 1988).
For example, you could use Goodman and Kruskal's gamma to understand whether there is an association between restaurant star rating and price bracket (i.e., where there are five possible star ratings – 1 star (*), 2 star (**), 3 star (***), 4 star (****) and 5 star (*****) – and price bracket is split into three categories: inexpensive ($), moderate ($$) and expensive ($$$)). Alternately, you could use Goodman and Kruskal's gamma to understand whether there is an association between test anxiety and exam duration (i.e., where test anxiety has three categories – low, moderate and high – and exam duration is split into four categories: 1 hour, 2 hours, 3 hours and 4 hours).
Note: Goodman and Kruskal's gamma can be used when both ordinal variables have just two categories. For example, you could use Goodman and Kruskal's gamma to understand whether there is an association between exam performance (i.e., with two categories: "pass" or "fail") and test anxiety level (i.e., with two categories: "high" or "low"). However, in such cases, another statistical test called Yule's Q, which is a special case of Goodman and Kruskal's gamma is typically used instead. Yule's Q can also be used to analyse the strength and direction of association between two dichotomous variables (e.g., an example of a dichotomous variable would be "gender", which has two categories: "males" and "females").
This "quick start" guide shows you how to carry out Goodman and Kruskal's gamma using SPSS Statistics. We show you the Crosstabs... procedure to carry out Goodman and Kruskal's gamma using SPSS Statistics in the section: SPSS Statistics procedure to carry out a Goodman and Kruskal's gamma analysis. First, we introduce you to the assumptions that you must consider when carrying out Goodman and Kruskal's gamma.
SPSS Statistics
Assumptions of Goodman and Kruskal's gamma
When you choose to analyse your data using Goodman and Kruskal's gamma, part of the process involves checking to make sure that the data you want to analyse can actually be analysed using Goodman and Kruskal's gamma. You need to do this because it is only appropriate to use Goodman and Kruskal's gamma if your data "passes" two assumptions that are required for Goodman and Kruskal's gamma to give you a valid result. In practice, checking for these two assumptions just adds a little bit more time to your analysis, requiring you to click of few more buttons in SPSS Statistics when performing your analysis, as well as think a little bit more about your data, but it is not a difficult task. These two assumptions are:
- Assumption #1: Your two variables should be measured on an ordinal scale. Examples of ordinal variables include Likert items (e.g., a 7-point scale from "strongly agree" through to "strongly disagree"), amongst other ways of ranking categories (e.g., a 5-point scale explaining how much a customer liked a product, ranging from "Not very much" to "Yes, a lot"). You can learn more about ordinal variables in our article: Types of Variable.
- Assumption #2: There needs to be a monotonic relationship between the two variables. A monotonic relationship exists when either the variables increase in value together, or as one variable value increases, the other variable value decreases. It is quite difficult to check this assumption when running a Goodman and Kruskal's gamma analysis.
While monotonicity is not actually an assumption of Goodman and Kruskal's gamma, you would not normally want to use Goodman and Kruskal's gamma to determine the strength and direction of a monotonic relationship if you already knew that the relationship between your two variables is not monotonic. Instead, the relationship between your two variables might be better described by another statistical measure of association. For this reason, it is good practice to try to determine whether the relationship between your two variables is monotonic, such that Goodman and Kruskal's gamma is the best choice as a measure of association, or whether another measure would be better.
If your data fails these assumptions, you should consider using a different statistical test, which we show you how to do in our Statistical Test Selector (N.B., this is part of our enhanced content).
In the section, SPSS Statistics procedure to carry out a Goodman and Kruskal's gamma analysis, we illustrate the SPSS Statistics procedure to perform Goodman and Kruskal's gamma assuming that no assumptions have been violated. First, we set out the example we use to explain the Goodman and Kruskal's gamma procedure in SPSS Statistics.
SPSS Statistics
Example used in this guide
A researcher at the Department of Health wants to determine if there is an association between the amount of physical activity people undertake and obesity levels. They recruited 250 people to take part in a study to find out. These participants were randomly sampled from the population.
Participants were asked to complete a questionnaire explaining their level of physical activity. Based on the results from this questionnaire, participants were categorized into one of five physical activity levels: "sedentary", "low", "moderate", "high" and "very high". Participants were also assessed by a nurse practitioner to determine their body fat classification. Based on this assessment, participants were categorized into one of four levels: "morbidly obese", "obese", "normal" and "underweight". These ordered responses reflected the categories of our two variables: physical_activity_level (i.e., with five categories: "sedentary", "low", "moderate", "high" and "very high") and body_fat_classification (i.e., with four categories: "morbidly obese", "obese", "normal" and "underweight").
Therefore, in the Variable View of SPSS Statistics two ordinal variables were created so that the data collected could be entered: physical_activity_level and body_fat_classification. Next, the data from the 250 participants was entered into the Data View of SPSS Statistics.
SPSS Statistics
Data setup in SPSS Statistics
For a Goodman and Kruskal's gamma, you will have either two or three variables:
(1) The ordinal variable, physical_activity_level, which has five ordered categories: "sedentary", "low", "moderate", "high" and "very high";
(2) The ordinal variable, body_fat_classification, which has four ordered categories: "underweight", "normal", "obese" and "morbidly obese".
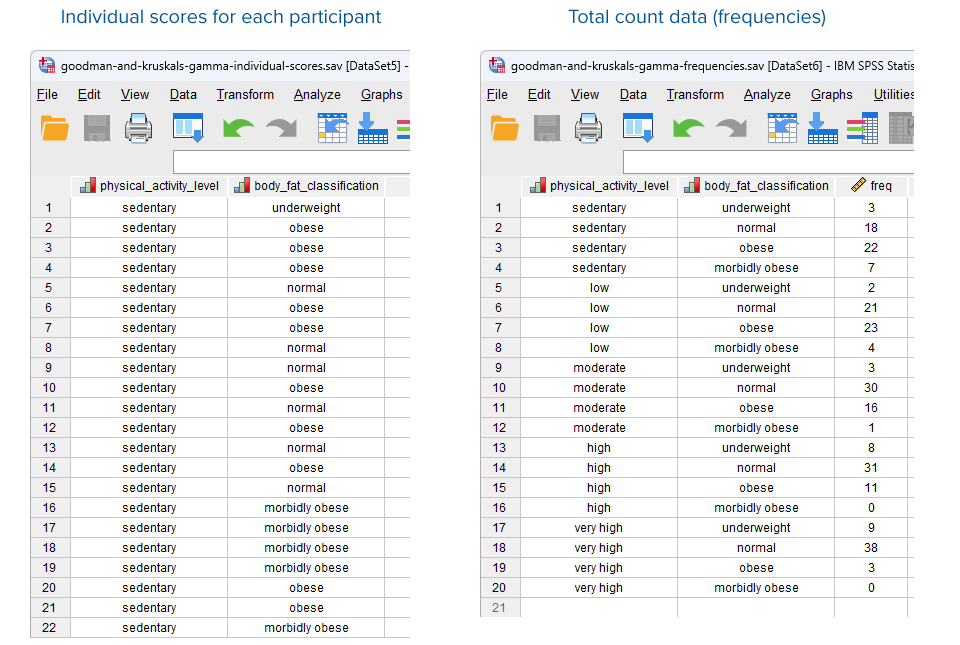
(3) The frequencies (i.e., total counts) for the two ordinal variables above (i.e., the number of participants for each cell combination). This is captured in the variable, freq.
In the diagram below, we show you how you would have set up your data in the Data View of SPSS Statistics if you had entered your data using: (a) the individual scores for each participant (shown in the diagram on the left below), where you only have two variables; or (b) total count data, also known as frequencies (shown in the diagram on the right below), where you have three variables.
Note: The data setup and procedure that follow are identical for SPSS Statistics versions 18 to 29, as well as the subscription version of SPSS Statistics, with version 29 and the subscription version being the latest versions of SPSS Statistics. However, in version 27, SPSS Statistics introduced a new look to their interface called "SPSS Light", replacing the previous look for versions 26 and earlier versions of SPSS Statistics, which was called "SPSS Standard". Therefore, if you have SPSS Statistics versions 26 or an earlier version of SPSS Statistics, the images that follow will be blue rather than light grey. However, the data setup and procedure are identical.

Published with written permission from SPSS Statistics, IBM Corporation.
If you are unsure how to correctly enter these variables into the Variable View and Data View of SPSS Statistics so that you can carry out your analysis, we show you how in our enhanced Goodman and Kruskal's gamma guide. Just remember that if you have entered your data using total count data (i.e., frequencies), shown in the diagram on the right above, you will also have to weight your cases before you can analyse your data (i.e., this is an additional procedure in SPSS Statistics). You can learn about our enhanced data setup content on our Features: Data Setup page or subscribe to the site to access our enhanced Goodman and Kruskal's gamma guide.
SPSS Statistics
SPSS Statistics procedure to carry out a Goodman and Kruskal's gamma analysis
The six steps below show you how to analyse your data using Goodman and Kruskal's gamma in SPSS Statistics when neither of the two assumptions in the previous section, Assumptions, have been violated. At the end of these six steps, we show you how to interpret the results from this test.
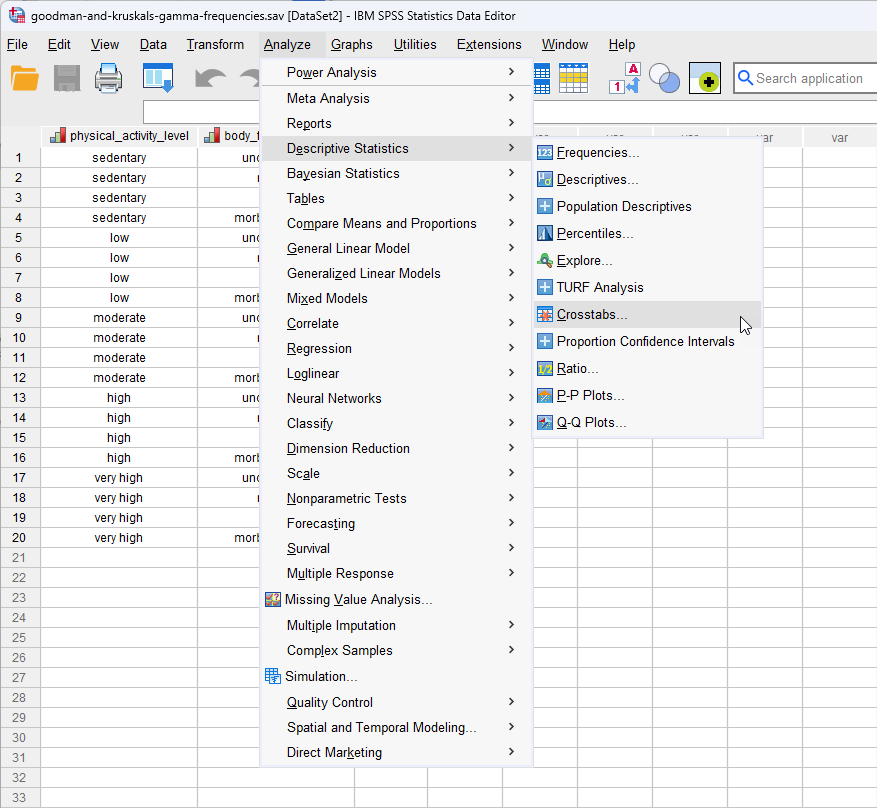
- Click Analyze > Descriptive Statistics > Crosstabs... on the top menu, as shown below:
Published with written permission from SPSS Statistics, IBM Corporation.
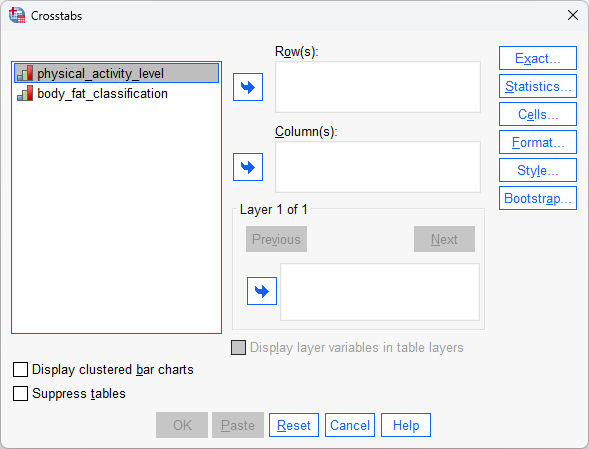
You will be presented with the Crosstabs dialogue box, as shown below:
Published with written permission from SPSS Statistics, IBM Corporation.
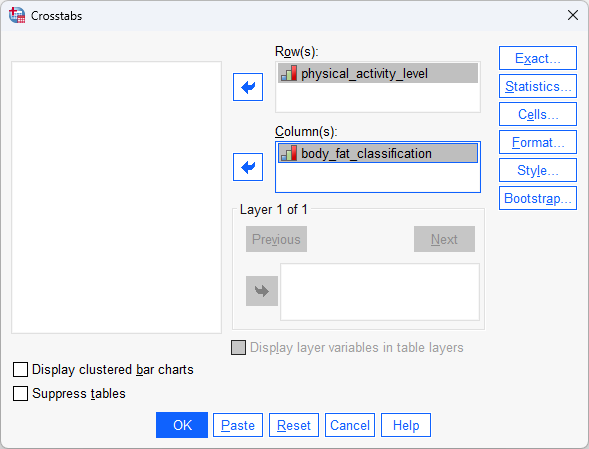
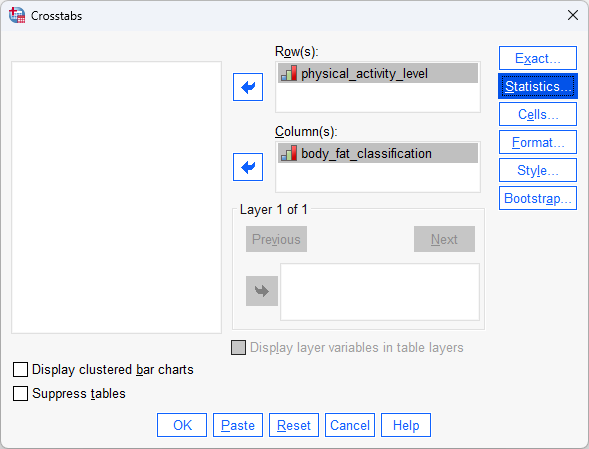
- Transfer the variable, physical_activity_level, into the Row(s): box, and the variable, body_fat_classification, into the Column(s): box, by dragging-and-dropping or by clicking the relevant buttons. You will end up with a screen similar to the one below:
Published with written permission from SPSS Statistics, IBM Corporation.
- Click on the button. You will be presented with the following Crosstabs: Statistics dialogue box:
Published with written permission from SPSS Statistics, IBM Corporation.
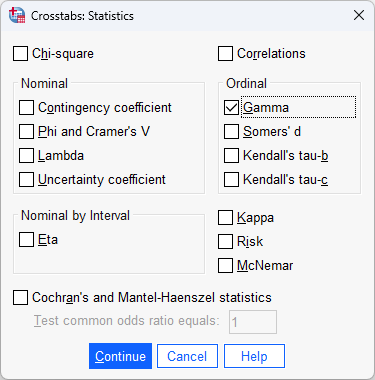
- Select the Gamma tick box in the –Ordinal– area, as shown below:
Published with written permission from SPSS Statistics, IBM Corporation.
- Click on the button. You will be returned to the Crosstabs dialogue box, as shown below:
Published with written permission from SPSS Statistics, IBM Corporation.
- Click on the button. This will generate the output for Goodman and Kruskal's gamma.
SPSS Statistics
Interpreting the results for Goodman and Kruskal's gamma
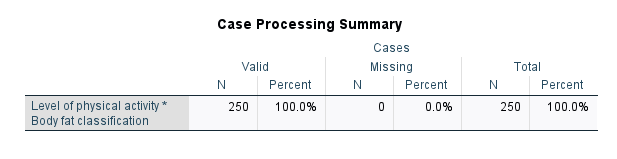
SPSS Statistics generates three main tables for the Goodman and Kruskal's gamma procedure that you ran in the previous section. In this "quick start" guide we focus on the results from the Goodman and Kruskal's gamma procedure only, assuming that your data met all the assumptions of this test. Therefore, when running the Goodman and Kruskal's gamma procedure, start with the Case Processing Summary table:
Published with written permission from SPSS Statistics, IBM Corporation.
The Case Processing Summary table provides a useful check of your data to determine the valid sample size, N, and whether you have any missing data. In our example, there were 250 participants with no missing data.
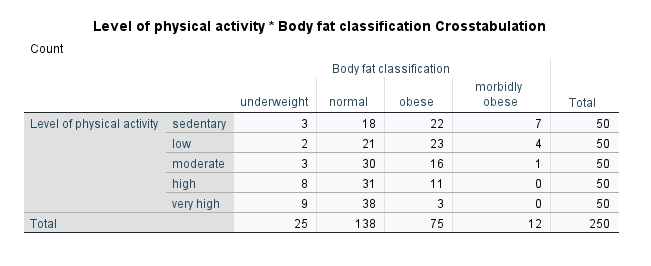
Next, you should get a 'feel' for your data using the table showing the crosstabulation of the data (this will be labelled based on your two ordinal variables; in our case, the Level of physical activity * Body fat classification Crosstabulation table), as shown below:
Published with written permission from SPSS Statistics, IBM Corporation.
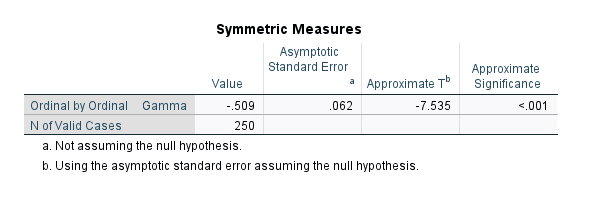
You can use this table to provide descriptive statistics, possibly presented in a table format, so that any readers of your work can understand (and replicate or extend) your results. Finally, you should consult the Symmetric Measures table, which provides the result of Goodman and Kruskal's gamma, as shown below:
Published with written permission from SPSS Statistics, IBM Corporation.
Goodman and Kruskal's gamma is presented in the "Gamma" row of the "Value" column and is -.509 in this example. This indicates that there is a strong, negative association between the level of physical activity and body fat classification. In other words, higher levels of physical activity (e.g., a "very high" level of physical activity) are associated with a lower body fat classification (e.g., an "underweight" body fat classification); and vice versa, with lower levels of physical activity (e.g., a "sedentary" level of physical activity) being associated with a higher body fat classification (e.g., a "morbidly obese" body fat classification).
Furthermore, the "Approx. Sig." column shows that the statistical significance value (i.e., p-value) is < .001, which means that the p-value is less than .001. Therefore, the association between physical activity level and body fat classification is statistically significant.
SPSS Statistics
Reporting the results for Goodman and Kruskal's gamma
In our example, you might present the results as follows:
Goodman and Kruskal's gamma was run to determine the association between physical activity level and body fat classification amongst 250 participants. There was a strong, negative correlation between physical activity level and health status, which was statistically significant (G = -.509, p < .001).
In our enhanced Goodman and Kruskal's gamma guide, we show you how to report your results using the Harvard and APA styles, as well as illustrating how to displaying your results in a clustered bar chart. You can learn more about our enhanced content on our Features: Overview page.
SPSS Statistics
Bibliography and Referencing
Please see the list below:
| Book | Agresti, A. (2013). Categorical data analysis (3rd ed.). Hoboken, NJ: John Wiley & Sons. |
| Book | Chen, P. Y., & Popovich, P. M. (2002). Correlation: Parametric and nonparametric measures. Thousand Oaks, CA: SAGE Publications. |
| Book | Cliff, N. (1996). Ordinal methods for behavioral data analysis. New York, NY: Psychology Press. |
| Journal Article | Goodman, L. A., & Kruskal, W. H. (1954). Measures of association for cross classification. Journal of the American Statistical Association, 49(268), 732-764. |
| Journal Article | Goodman, L. A., & Kruskal, W. H. (1959). Measures of association for cross classification II: Further discussion and references. Journal of the American Statistical Association, 54(285), 123-163. |
| Journal Article | Goodman, L. A., & Kruskal, W. H. (1963). Measures of association for cross classification III: Approximate sample theory. Journal of the American Statistical Association, 58(302), 310-364. |
| Journal Article | Goodman, L. A., & Kruskal, W. H. (1972). Measures of association for cross classification IV: Simplification for asymptotic variances. Journal of the American Statistical Association, 67(338), 415-421. |
| Book | Sheskin, D. J. (2011). Handbook of parametric and nonparametric statistical procedures (5th ed.). Boca Raton, FL: CRC Press. |
| Book | Siegel, S., & Castellan, Jr., N. J. (1988). Nonparametric statistics for the behavioral sciences (2nd ed.). New York, NY: McGraw-Hill Book Company. |
SPSS Statistics
Reference this article
Laerd Statistics (2023). Goodman and Kruskal's gamma using SPSS Statistics. Statistical tutorials and software guides. Retrieved Month, Day, Year, from https://statistics.laerd.com/spss-tutorials/goodman-and-kruskals-gamma-using-spss-statistics.php
For example, if you viewed this guide on 10th January 2023, you would use the following reference:
Laerd Statistics (2019). Goodman and Kruskal's gamma using SPSS Statistics. Statistical tutorials and software guides. Retrieved October, 10, 2023, from https://statistics.laerd.com/spss-tutorials/goodman-and-kruskals-gamma-using-spss-statistics.php