Login

Kendall's Tau-b using SPSS Statistics

Introduction

Kendall's tau-b (τb) correlation coefficient (Kendall's tau-b, for short) is a nonparametric measure of the strength and direction of association that exists between two variables measured on at least an ordinal scale. It is considered a nonparametric alternative to the Pearson’s product-moment correlation when your data has failed one or more of the assumptions of this test. It is also considered an alternative to the nonparametric Spearman rank-order correlation coefficient (especially when you have a small sample size with many tied ranks). If you consider one of your variables as an independent variable and the other as a dependent variable, you might consider running a Somers' d test instead.

For example, you could use Kendall's tau-b to understand whether there is an association between exam grade and time spent revising (i.e., where there were six possible exam grades – A, B, C, D, E and F – and revision time was split into five categories: less than 5 hours, 5-9 hours, 10-14 hours, 15-19 hours, and 20 hours or more). Alternately, you could use Kendall's tau-b to understand whether there is an association between customer satisfaction and delivery time (i.e., where delivery time had four categories – next day, 2 working days, 3-5 working days, and more than 5 working days – and customer satisfaction was measured in terms of the level of agreement customers had with the following statement, "I am satisfied with the time it took for my parcel to be delivered", where the level of agreement had five categories: strongly agree, agree, neither agree nor disagree, disagree and strongly disagree).

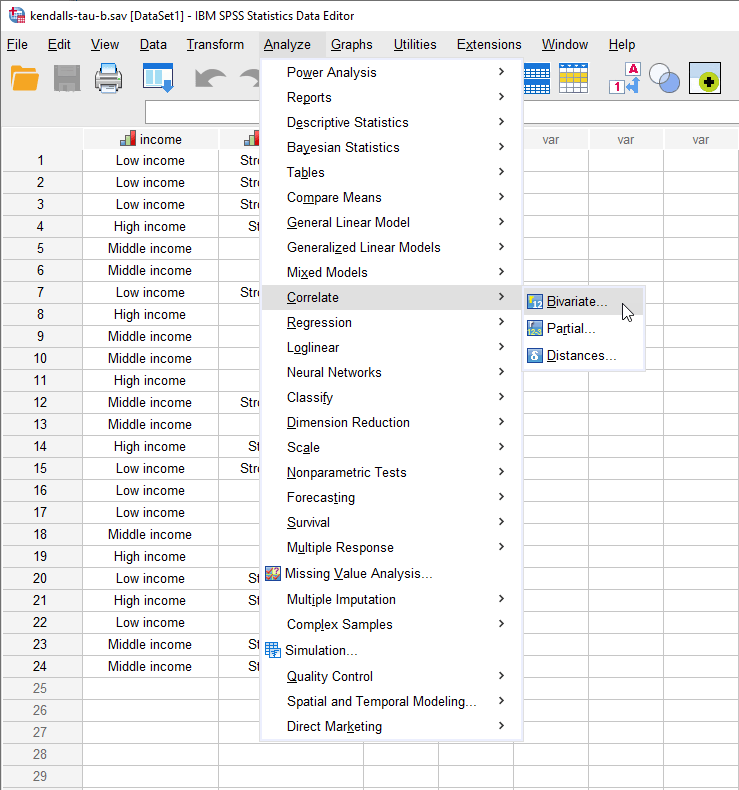
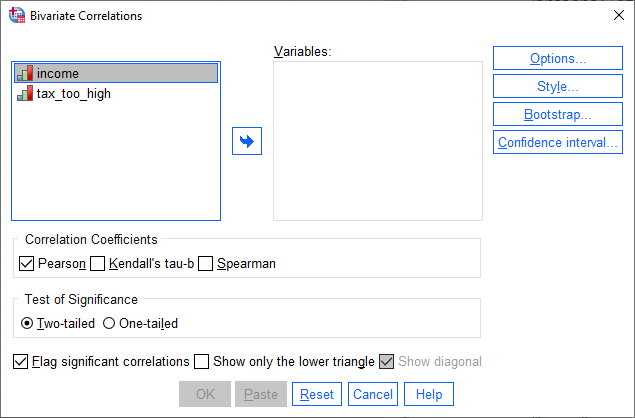
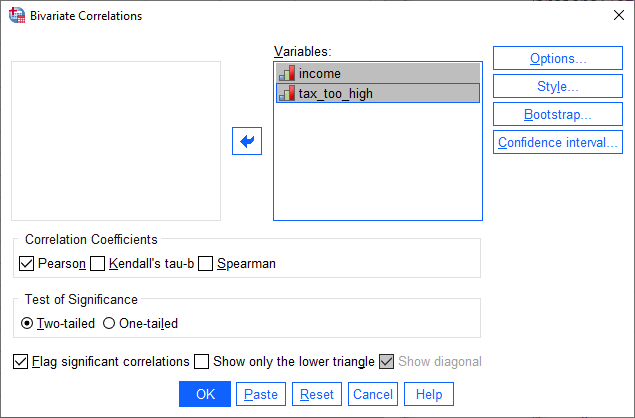
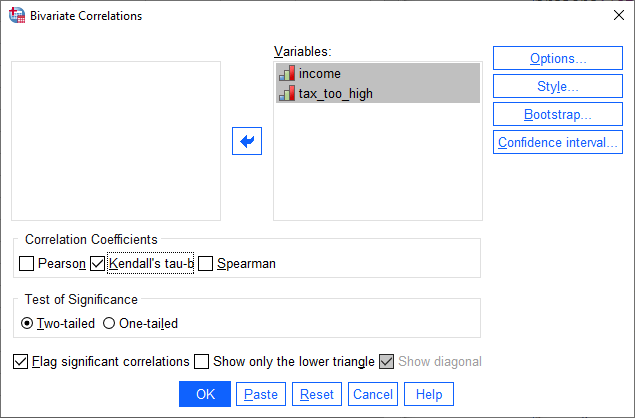
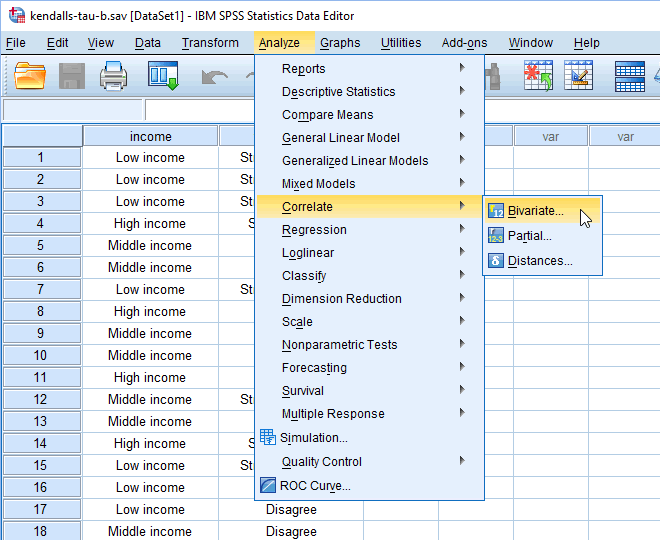
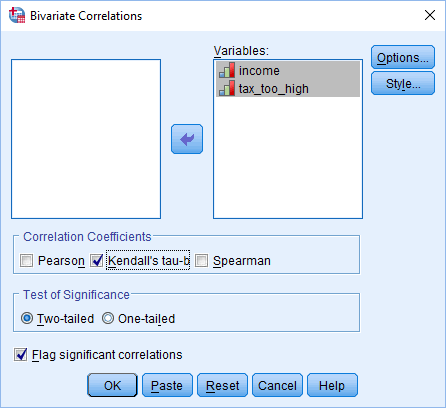
This "quick start" guide shows you how to carry out Kendall's tau-b using SPSS Statistics. We show you the main procedure to carry out Kendall's tau-b in the Procedure section. However, first we introduce you to the assumptions that you must consider when carrying out Kendall's tau-b.

SPSS Statistics

Assumptions

When you choose to analyse your data using Kendall's tau-b, part of the process involves checking to make sure that the data you want to analyse can actually be analysed using Kendall's tau-b. You need to do this because it is only appropriate to use Kendall's tau-b if your data "passes" the assumptions that are required for Kendall's tau-b to give you a valid result. In practice, checking for these assumptions just adds a little bit more time to your analysis, requiring you to click of few more buttons in SPSS Statistics when performing your analysis, as well as think a little bit more about your data, but it is not a difficult task. These two assumptions are:

In the section, Test Procedure in SPSS Statistics, we illustrate the SPSS Statistics procedure to perform Kendall's tau-b assuming that no assumptions have been violated. First, we set out the example we use to explain the Kendall's tau-b procedure in SPSS Statistics.

Testimonials
TAKE THE TOUR


SPSS Statistics

Example & Data Setup in SPSS Statistics

Taxes have the ability to elicit strong responses in many people, with some thinking they are too high, whilst others think they should be higher. A researcher conducted a simple study where they presented participants with the statement: "Tax is too high in this country", and asked them how much they agreed with this statement. They had four options how to respond: "Strongly Disagree", "Disagree", "Agree" or "Strongly Agree". These ordered responses were the categories of the dependent variable, tax_too_high. The researcher also asked participants to state whether they had a "low", "middle" or "high" income, where each of these categories had specified income ranges (e.g., a low income was any income under £18,000 per annum). The income level of participants was recorded in the variable, income.

Therefore, in the Variable View of SPSS Statistics two ordinal variables were created so that the data collected could be entered: income and tax_too_high. Next, the data from 24 participants was entered into the Data View of SPSS Statistics.

SPSS Statistics

Test Procedure in SPSS Statistics

The Correlate > Bivariate... procedure below shows you how to analyse your data using Kendall's tau-b in SPSS Statistics when neither of the two assumptions in the previous section, Assumptions, have been violated. At the end of these four steps, we show you how to interpret the results from this test.

Since some of the options in the Correlate > Bivariate... procedure changed in SPSS Statistics version 27 and the subscription version of SPSS Statistics, we show how to carry out Kendall's tau-b depending on whether you have SPSS Statistics versions 27 or 28 (or the subscription version of SPSS Statistics) or version 26 or an earlier version of SPSS Statistics. The latest versions of SPSS Statistics are version 27 and the subscription version. If you are unsure which version of SPSS Statistics you are using, see our guide: Identifying your version of SPSS Statistics.

SPSS Statistics versions 27 and 28
(and the subscription version of SPSS Statistics)
  1. Click Analyze > Correlate > Bivariate... on the top menu, as shown below:
    Menu for Kendall's tau-b in SPSS Statistics

    Published with written permission from SPSS Statistics, IBM Corporation.


    You will be presented with the Bivariate Correlations dialogue box, as shown below:
    'Bivariate Correlations' dialogue box for Kendall's tau-b in SPSS Statistics. Variables 'income' & 'tax_too_high' on the left

    Published with written permission from SPSS Statistics, IBM Corporation.

  2. Transfer the variables income and tax_too_high into the Variables: box by clicking on the Right arrow button. You will end up with the following screen:
    'Bivariate Correlations' dialogue box for Kendall's tau-b in SPSS. 'income' & 'tax_too_high' transferred into 'Variables' box

    Published with written permission from SPSS Statistics, IBM Corporation.

  3. Deselect the Pearson checkbox and select the Kendall's tau-b checkbox in the –Correlation Coefficients– area, as shown below:
    'Bivariate Correlations' dialogue box for Kendall's tau-b. 'Kendall's tau-b' selected in 'Correlation Coefficients' area

    Published with written permission from SPSS Statistics, IBM Corporation.

  4. Select the Show only the lower triangle checkbox and then deselect the Show diagonal checkbox, as shown below:
    'Bivariate Correlations' dialogue box for Kendall's tau-b. 'Only lower triangle' selected in 'Correlation Coefficients' area

    Published with written permission from SPSS Statistics, IBM Corporation.

  5. Click on the OK button.

Now that you have run the Correlate > Bivariate... procedure to carry out Kendall's tau-b, go to the Interpreting Results section. You can ignore the section below, which shows you how to carry out Kendall's tau-b if you have SPSS Statistics version 26 or an earlier version of SPSS Statistics.

Join the 10,000s of students, academics and professionals who rely on Laerd Statistics.TAKE THE TOUR
SPSS Statistics version 26
and earlier versions of SPSS Statistics
  1. Click Analyze > Correlate > Bivariate... on the top menu, as shown below:
    Menu for Kendall's tau-b in SPSS Statistics

    Published with written permission from SPSS Statistics, IBM Corporation.


    You will be presented with the Bivariate Correlations dialogue box, as shown below:
    'Bivariate Correlations' dialogue box for Kendall's tau-b in SPSS Statistics. Variables 'income' & 'tax_too_high' on the left

    Published with written permission from SPSS Statistics, IBM Corporation.

  2. Transfer the variables income and tax_too_high into the Variables: box by dragging-and-dropping or by clicking on the Right arrow button. You will end up with a screen similar to the one below:
    'Bivariate Correlations' dialogue box for Kendall's tau-b in SPSS. 'income' & 'tax_too_high' transferred into 'Variables' box

    Published with written permission from SPSS Statistics, IBM Corporation.

  3. Make sure that you uncheck the Pearson tick box (it is selected by default in SPSS Statistics) and check the Kendall's tau-b tick box in the –Correlation Coefficients– area, as shown below:
    'Bivariate Correlations' dialogue box for Kendall's tau-b. 'Kendall's tau-b' selected in 'Correlation Coefficients' area

    Published with written permission from SPSS Statistics, IBM Corporation.

  4. Click on the OK button.
Join the 10,000s of students, academics and professionals who rely on Laerd Statistics.TAKE THE TOUR
SPSS Statistics

Interpreting the Results for Kendall's Tau-b

SPSS Statistics generates one main table for the Kendall's tau-b procedure that you ran in the previous section. If your data passed assumption #2 (i.e., there is a monotonic relationship between your two variables), which we explained earlier in the Assumptions section, you will only need to interpret this one table. However, since you should have tested your data for this assumption, you will also need to interpret the SPSS Statistics output that was produced when you tested for it (i.e., your scatterplot results). Remember that if your data failed this assumption, the output that you get from the Kendall's tau-b procedure (i.e., the table we discuss below) will no longer be correct.

In this "quick start" guide we focus on the results from the Kendall's tau-b procedure only, assuming that your data met this assumption. Therefore, if you ran the Kendall's tau-b procedure in the previous section using SPSS Statistics versions 27 or 28 (or the subscription version of SPSS Statistics), you will be presented with the Correlations table below:

'Correlations' table for Kendall's tau-b in SPSS Statistics. Shows 'Correlation Coefficient', 'Sig. (2-tailed)' & 'N'

Published with written permission from SPSS Statistics, IBM Corporation.

Note: If you ran the Kendall's tau-b procedure using SPSS Statistics version 26 or an earlier version of SPSS Statistics, the Correlations table will look like the one below:

'Correlations' table for Kendall's tau-b in SPSS Statistics. Shows 'Correlation Coefficient', 'Sig. (2-tailed)' & 'N'

The results in this table are identical to those produced in versions 27 and 28 (and the subscription version of SPSS Statistics), but are simply displayed using a different layout (i.e., the results are displayed in a matrix where the correlations are replicated).

The Correlations table presents Kendall's tau-b correlation, its significance value and the sample size that the calculation was based on. In this example, we can see that Kendall's tau-b correlation coefficient, τb, is 0.535, and that this is statistically significant (p = 0.003).

SPSS Statistics

Reporting the Results for Kendall's Tau-b

In our example, you might present the results as follows:

A Kendall's tau-b correlation was run to determine the relationship between income level and views towards income taxes amongst 24 participants. There was a strong, positive correlation between income level and the view that taxes were too high, which was statistically significant (τb = .535, p = .003).

Join the 10,000s of students, academics and professionals who rely on Laerd Statistics.TAKE THE TOUR
1