Ordinal Regression using SPSS Statistics (cont...)
Procedure V – Generating odds ratios
Follow the instructions below to generate odds ratios:
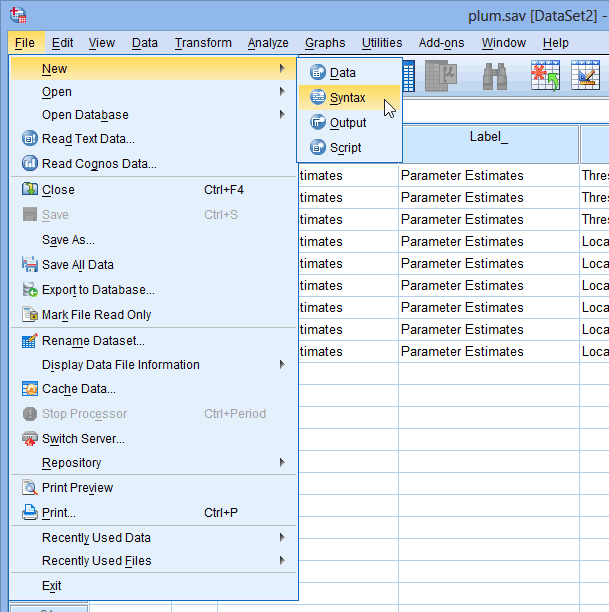
- Click File > New > Syntax on the main menu, as shown below:

Published with written permission from SPSS Statistics, IBM Corporation.
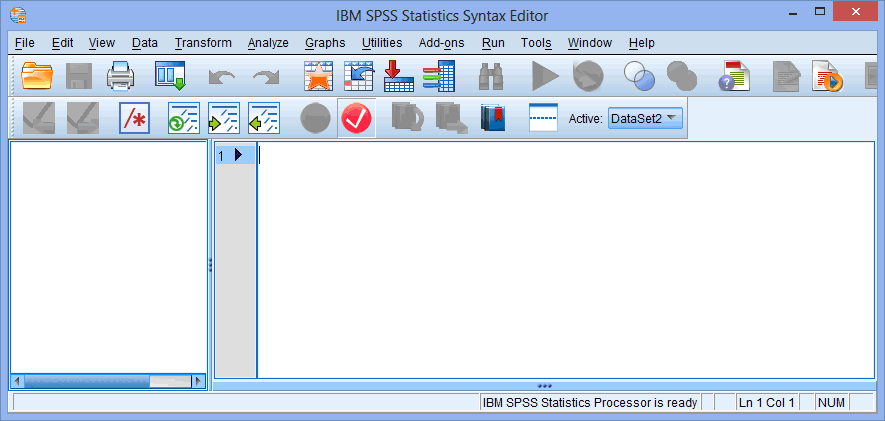
You will be presented with the IBM SPSS Statistics Statistics Syntax Editor window, as shown below:
Published with written permission from SPSS Statistics, IBM Corporation.
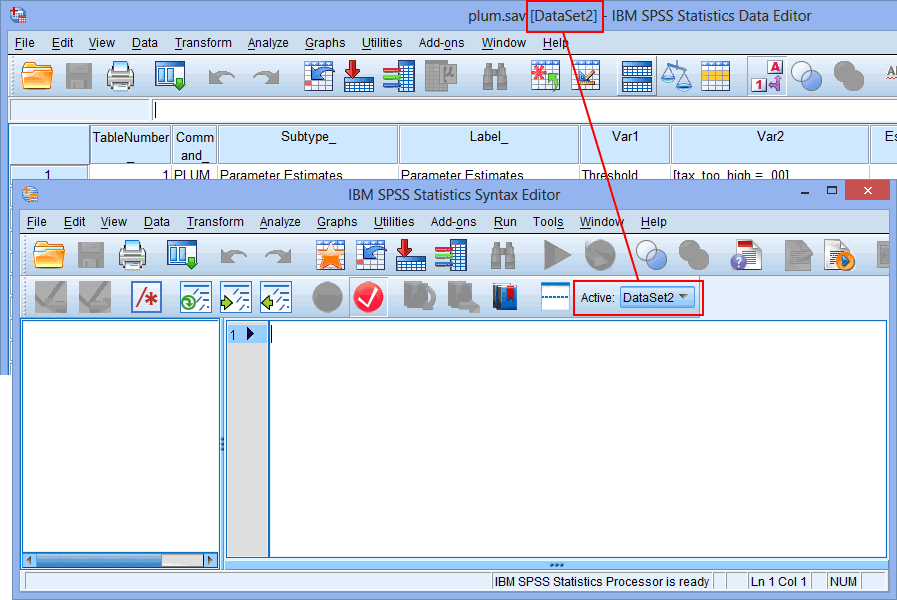
- Make sure that you are working with the correct dataset. You can do this by confirming that the name in brackets after the plum.sav file name in the IBM SPSS Statistics Statistics Data Editor window is the same as selected for the Active: option in the IBM SPSS Statistics Statistics Syntax Editor window, as highlighted below:
Published with written permission from SPSS Statistics, IBM Corporation.
Note: Although the name of the dataset above is "DataSet2", yours might be called something different. This is OK so long as they are the same.
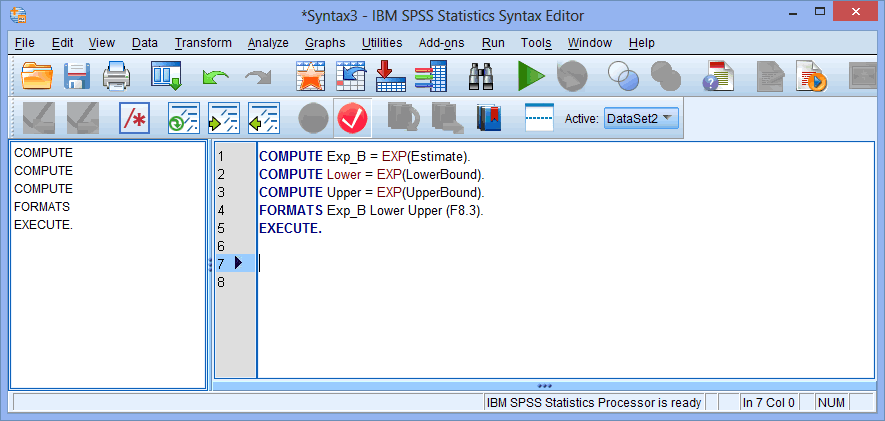
- To calculate the odds ratios and their 95% confidence intervals in the new file, copy the following highlighted syntax into the Syntax Editor verbatim:
Published with written permission from SPSS Statistics, IBM Corporation.
Explanation: This last stage calculates the odds ratios and their 95% confidence intervals from the parameter estimates and stores these values in new variables within the 'plum' file. To make life simpler, you can copy and paste the following code for this last part: COMPUTE Exp_B = EXP(Estimate).
COMPUTE Lower = EXP(LowerBound).
COMPUTE Upper = EXP(UpperBound).
FORMATS Exp_B Lower Upper (F8.3).
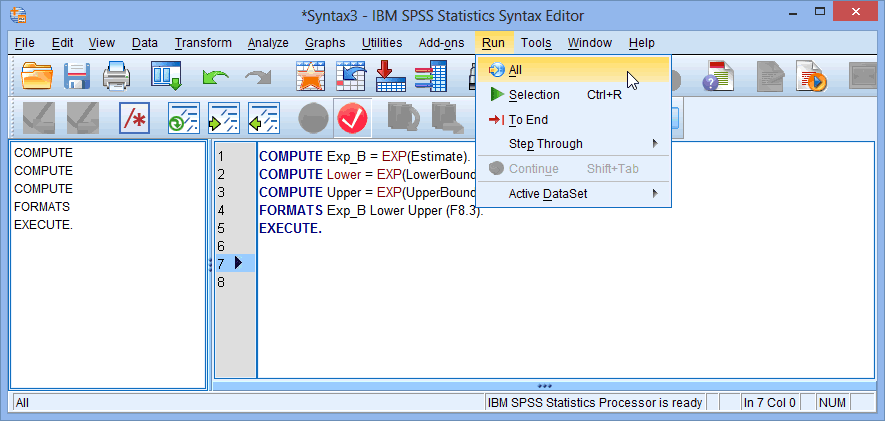
EXECUTE. - Click Run > All on the main menu to generate the output, as shown below:
Published with written permission from SPSS Statistics, IBM Corporation.
You will have added some extra columns into your file that represent the odds ratio and its 95% confidence intervals, as highlighted below:
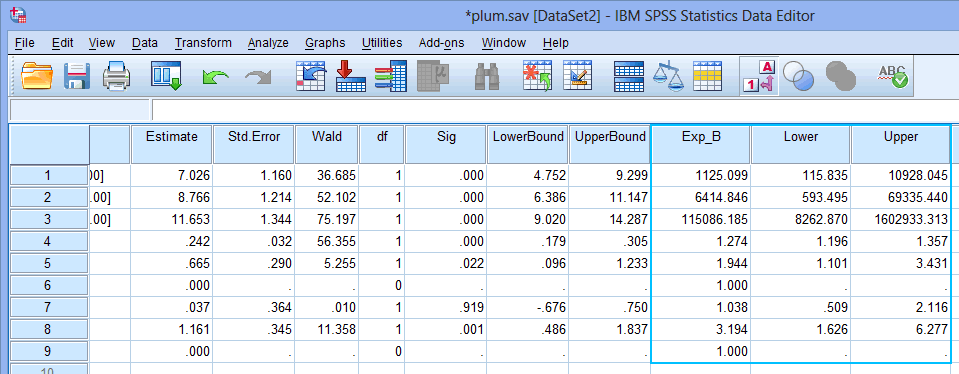
Published with written permission from SPSS Statistics, IBM Corporation.
Having run all five steps of the SPSS Statistics procedures, you should now have all the information you need to start interpreting the results from your ordinal regression.
