Ordinal Regression using SPSS Statistics (cont...)
Procedure II – Running the PLUM Procedure
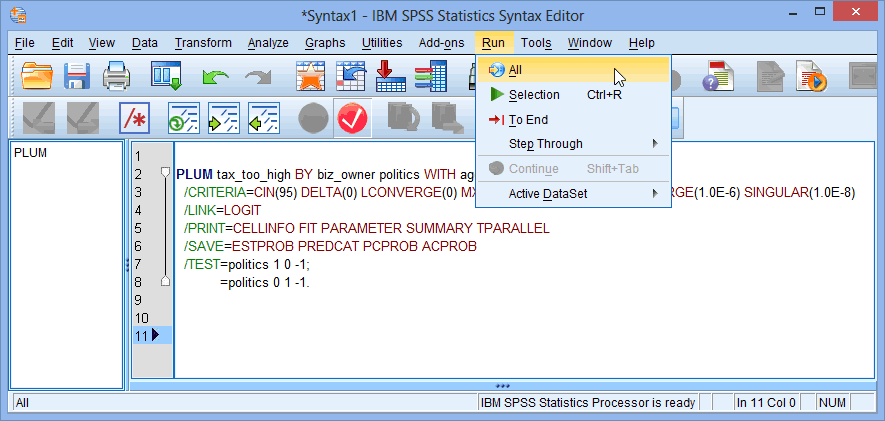
The instructions below show you how to run the PLUM procedure. Some of this will require using syntax, but we explain what you need to do. This step produces some of the main results for your ordinal regression analysis, including predicted probabilities, amongst other useful statistical measures we discuss in the Interpretation and Reporting section later.
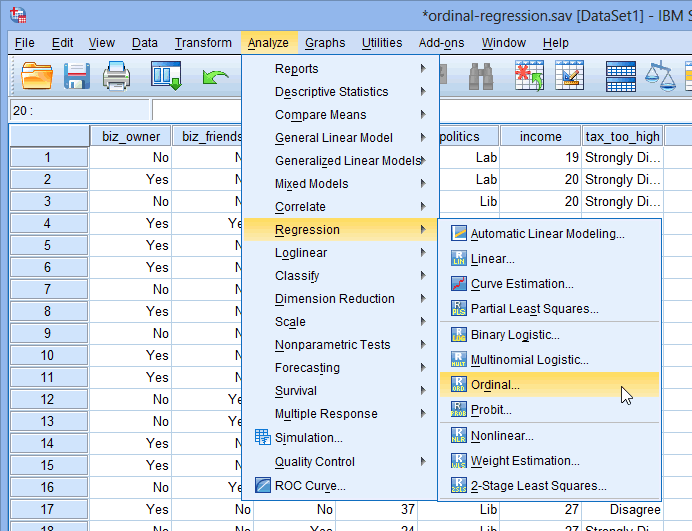
- Click Analyze > Regression > Ordinal... on the main menu, as shown below:

Published with written permission from SPSS Statistics, IBM Corporation.
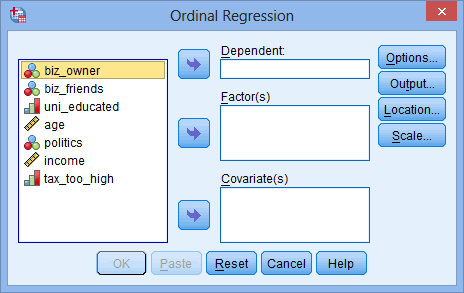
You will be presented with the Ordinal Regression dialogue box, as shown below:
Published with written permission from SPSS Statistics, IBM Corporation.
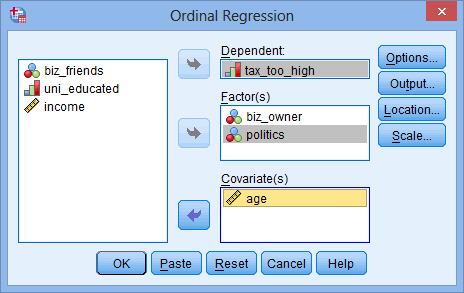
- Transfer the ordinal dependent variable – tax_too_high – into the Dependent: box. Next, transfer the categorical independent variables – biz_owner and politics – into the Factor(s) box and the continuous independent variable – age – into the Covariate(s) box, using the appropriate buttons. You will end up with a screen similar to that below:
Published with written permission from SPSS Statistics, IBM Corporation.
Explanation: Ordinal regression can accept independent variables that are either nominal, ordinal or continuous, although ordinal independent variables need to be treated as either nominal or continuous variables. In the Ordinal Regression dialogue box, independent nominal variables are transferred into the Factor(s) box and independent continuous variables are transferred into the Covariate(s) box. You can transfer an ordinal independent variable into either the Factor(s) or Covariate(s) box depending on how you wish the ordinal variable to be treated. However, this is a decision that you need to make.
- Click on the button and you will be presented with the Ordinal Regression: Options dialogue box, as shown below:
Published with written permission from SPSS Statistics, IBM Corporation.
Note: It is unlikely that you will need to change any of the options in the Ordinal Regression: Options dialogue box shown above. Indeed, in this example you will not change anything. However, if you wanted to change the confidence intervals (the Confidence interval: box) from 95% or change the type of link function (the Link: drop-down box) used, you could do that here.
- Click on the button and you will be returned to the Ordinal Regression dialogue box.
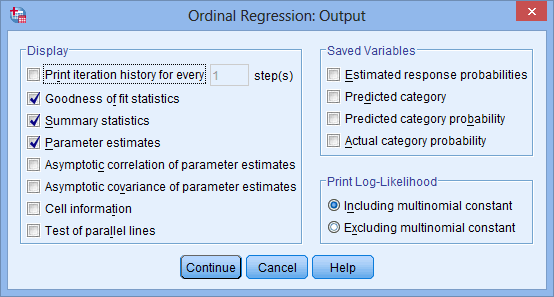
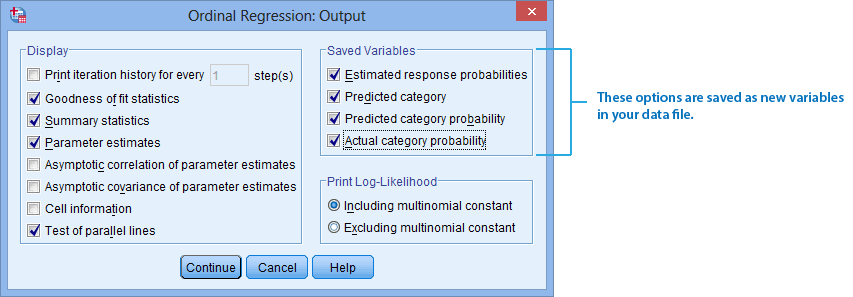
- Click on the button and you will be presented with the Ordinal Regression: Output dialogue box, as shown below:
Published with written permission from SPSS Statistics, IBM Corporation.
- In addition to the options already selected, select Test of parallel lines in the –Display– area. Also, in the –Saved Variables– area, select all four options: Estimated response probabilities, Predicted category, Predicted category probability and Actual category probability. You will end up with a screen similar to below:
Published with written permission from SPSS Statistics, IBM Corporation.
Note 1: When you only have categorical independent variables, you may also want to select Cell information. However, as a general rule, the Cell information option is not very useful when you have continuous independent variables in the model (as in this example).
Note 2: Keeping the default Including multinomial constant option selected in the –Print Log-Likelihood– area results in the FULL log-likelihood being produced, whereas the Excluding multinomial constant option results in the KERNAL of the log-likelihood being produced. This affects the value of the log-likelihood, but not the conclusion. This is explained in our enhanced ordinal regression guide if you are unsure.
- Click on the button and you will be returned to the Ordinal Regression dialogue box.