Moderator Analysis with a Dichotomous Moderator using SPSS Statistics
Introduction
A moderator analysis is used to determine whether the relationship between two variables depends on (is moderated by) the value of a third variable. This relationship is commonly between: (a) a continuous dependent variable and continuous independent variable, which is modified by a dichotomous moderator variable; (b) a continuous dependent variable and continuous independent variable, which is modified by a polytomous moderator variable; or (c) a continuous dependent variable and continuous independent variable, which is modified by a continuous moderator variable. In this guide, we focus on (a); namely, the relationship between a continuous dependent variable and continuous independent variable, which is modified by a dichotomous moderator variable.
We use the standard method of determining whether a moderating effect exists, which entails the addition of an (linear) interaction term in a multiple regression model. For this reason, you might often hear this type of analysis being referred to as a moderated multiple regression or as its abbreviation, MMR (e.g., Aguinis, 2004). Indeed, a moderator analysis is really just a multiple regression equation with an interaction term. What makes it a moderator analysis is the theory and subsequent hypotheses that surround this statistical test (e.g., Aguinis, 2004; Jaccard & Turrisi, 2003; Jose, 2013).
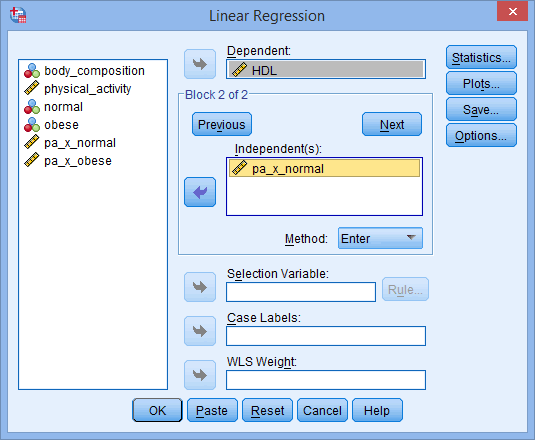
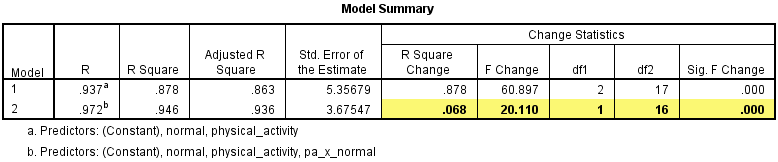
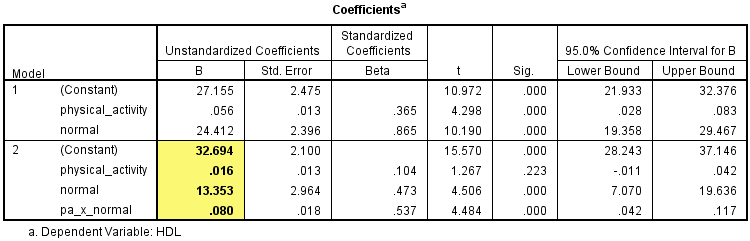
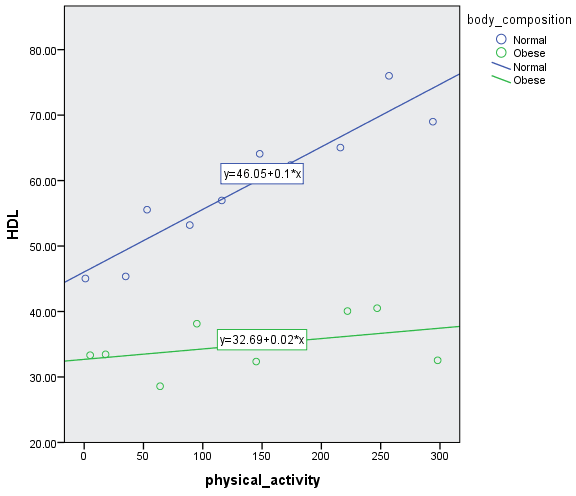
For example, a moderator analysis can be used to determine whether the relationship between HDL cholesterol and amount of exercise performed per week is different for normal weight and obese participants (i.e., the continuous dependent variable is "HDL cholesterol", the continuous independent variable is "amount of exercise performed per week" and the dichotomous moderator variable is "body composition", consisting of two groups: "normal weight" and "obese")? If it is, body composition (i.e., the dichotomous moderator variable) moderates the relationship between the amount of exercise performed per week and HDL cholesterol concentration. Alternately, you could use a moderator analysis to determine whether the relationship between salary and years of education is moderated by gender (i.e., the continuous dependent variable is "salary", the continuous independent variable is "years of education" and the dichotomous moderator variable is "gender", which consists of two groups: "males" and "females"). If it is, gender (i.e., the dichotomous moderator variable) moderates the relationship between the years of education and salary.
This "quick start" guide shows you how to carry out a moderator analysis with a dichotomous moderator variable using SPSS Statistics, as well as interpret and report the results from this test. However, before we introduce you to this procedure, you need to understand the different assumptions that your data must meet in order for the moderator analysis to give you a valid result. We discuss these assumptions next.
SPSS Statistics
Assumptions of a moderator analysis with a dichotomous moderator
When you choose to run a moderator analysis using multiple regression, part of the process involves checking to make sure that the data you want to analyse can actually be analysed using multiple regression. You need to do this because it is only appropriate to use a moderator analysis using multiple regression if your data "passes" eight assumptions that are required for multiple regression to give you a valid result. In practice, checking for these eight assumptions just adds a little bit more time to your analysis, requiring you to click a few more buttons in SPSS Statistics when performing your analysis, as well as think a little bit more about your data, but it is not a difficult task.
Before we introduce you to these eight assumptions, do not be surprised if, when analysing your own data using SPSS Statistics, one or more of these assumptions is violated (i.e., not met). This is not uncommon when working with real-world data rather than textbook examples, which often only show you how to carry out a moderator analysis using multiple regression when everything goes well! However, don’t worry. Even when your data fails certain assumptions, there is often a solution to overcome this. First, let's take a look at these eight assumptions:
- Assumption #1: Your dependent variable should be measured on a continuous scale (i.e., it is either an interval or ratio variable). Examples of variables that meet this criterion include revision time (measured in hours), intelligence (measured using IQ score), exam performance (measured from 0 to 100), weight (measured in kg), and so forth. You can learn more about interval and ratio variables in our article: Types of Variable.
- Assumption #2: You have one independent variable, which is continuous (i.e., an interval or ratio variable) and one moderator variable that is dichotomous (i.e., a nominal variable with two groups). For examples of continuous variables, see the bullet above. Examples of dichotomous variables include gender (e.g., two groups: male and female), physical activity level (e.g., two groups: sedentary and active), body composition (e.g., two groups: normal weight and obese), and so forth. Again, you can learn more about variables in our article: Types of Variable.
- Assumption #3: You should have independence of observations (i.e., independence of residuals), which you can check using the Durbin-Watson statistic, which is a simple test to run using SPSS Statistics.
- Assumption #4: There needs to be a linear relationship between the dependent variable and the independent variable for each group of the dichotomous moderator variable. Whilst there are a number of ways to check for these linear relationships, you can create a scatterplot using SPSS Statistics, and then visually inspecting this scatterplot to check for linearity. If the relationship displayed in your scatterplot is not linear, you will have to either run a non-linear regression analysis or "transform" your data, which you can do using SPSS Statistics. In our enhanced moderator guide, we show you how to create and interpret a scatterplot to check for linearity when carrying out a moderator analysis using SPSS Statistics and some of the options available to you when you do not have linearity.
- Assumption #5: Your data needs to show homoscedasticity, which is when the error variances are the same for all combinations of independent and moderator variables. We explain more about what this means and how to assess the homoscedasticity of your data in our enhanced moderator analysis guide. When you analyse your own data, you will need to plot the studentized residuals against the unstandardized predicted values for both groups of the moderator variable. In our enhanced moderator analysis guide, we explain: (a) how to test for homoscedasticity using SPSS Statistics; (b) some of the things you will need to consider when interpreting your data; and (c) possible ways to continue with your analysis if your data fails to meet this assumption.
- Assumption #6: Your data must not show multicollinearity, which occurs when you have two or more independent variables that are highly correlated with each other. This leads to problems with understanding which independent variable contributes to the variance explained in the dependent variable, as well as technical issues in calculating a multiple regression model. Therefore, in our enhanced moderator analysis guide, we show you: (a) how to use SPSS Statistics to detect for multicollinearity through an inspection of correlation coefficients and Tolerance/VIF values; and (b) how to interpret these correlation coefficients and Tolerance/VIF values so that you can determine whether your data meets or violates this assumption.
- Assumption #7: There should be no significant outliers, high leverage points or highly influential points. Outliers, leverage and influential points are different terms used to represent observations in your data set that are in some way unusual when you wish to perform a moderator analysis. These different classifications of unusual points reflect the different impact they have on the moderated multiple regression. An observation can be classified as more than one type of unusual point. However, all these points can have a very negative effect on the regression equation that is used to analyse this type of moderator analysis. This can change the output that SPSS Statistics produces and reduce the accuracy of your results as well as the statistical significance. Fortunately, when using SPSS Statistics you can detect possible outliers, high leverage points and highly influential points. In our enhanced moderator analysis guide, we: (1) show you how to detect outliers using "studentized deleted residuals" and discuss some of the options you have in order to deal with outliers; (2) check for leverage points using SPSS Statistics, and discuss what you should do if you have any; and (3) check for influential points in SPSS Statistics using a measure of influence known as Cook's Distance, before presenting some practical approaches in SPSS Statistics to deal with any influential points you might have.
- Assumption #8: Finally, you need to check that the residuals (errors) are approximately normally distributed. Methods to do this can be based either on graphical or numerical methods. In our enhanced moderator analysis guide, we: (a) show you how to check this assumption using the Shapiro-Wilk test for normality using SPSS Statistics; (b) explain how to interpret the result; and (c) provide possible options if your data fails to meet this assumption.
You can check assumptions #3, #4, #5, #6, #7 and #8 using SPSS Statistics. Assumptions #1 and #2 should be checked first, before moving onto assumptions #3, #4, #5, #6, #7 and #8. Just remember that if you do not run the statistical tests on these assumptions correctly, the results you get when running the moderator analysis might not be valid. This is why we dedicate a number of sections of our enhanced moderator analysis guide to help you get this right. You can find out about our enhanced content as a whole on our Features: Overview page, or more specifically, learn how we help with testing assumptions on our Features: Assumptions. Alternately, you can access the enhanced moderator analysis guide now by subscribing to Laerd Statistics.
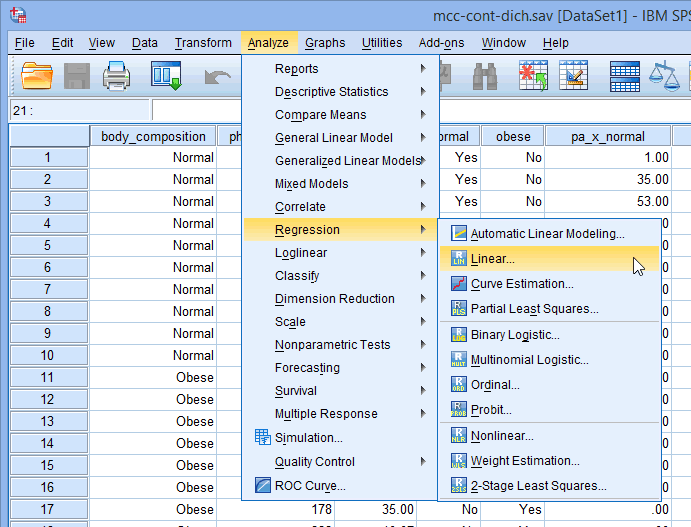
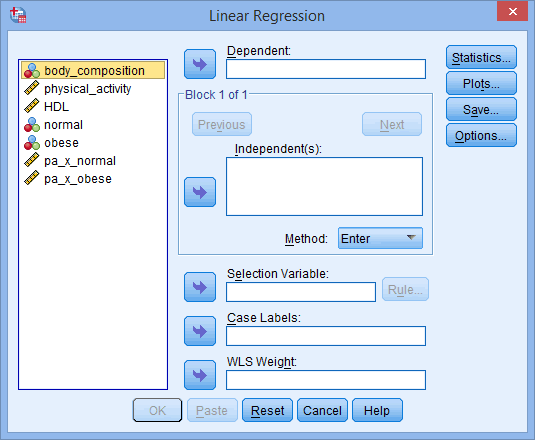
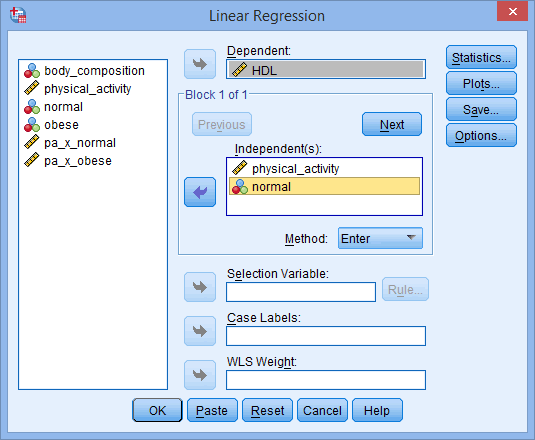
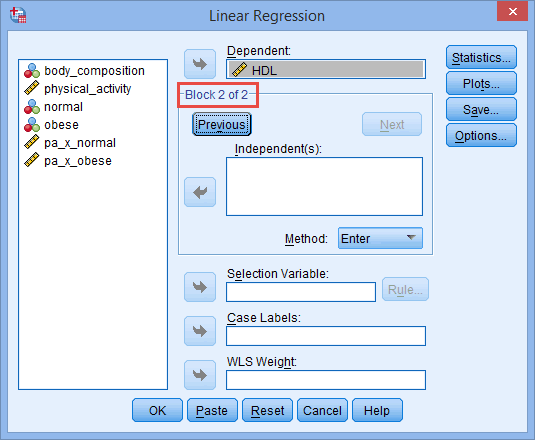
In the section, Procedure, we illustrate the SPSS Statistics procedure to perform a moderator analysis assuming that no assumptions have been violated. First, we introduce the example that is used in this guide.