Independent-samples t-test using R, Excel and RStudio (page 2)
On the previous page you learnt about the type of research where an independent-samples t-test can be used and the critical assumptions of the independent-samples t-test that your study design, variables and data must meet in order for the independent-samples t-test to be the correct statistical test for your analysis. On this page, we set out the example we use to illustrate how to carry out an independent-samples t-test using R, before showing how to set up your data using Microsoft Excel, R and RStudio. Therefore, start by reading the example we use throughout this introductory guide in the next section.
R and RStudio
Example
A researcher wanted to know whether exercise could improve a person’s cardiovascular health. One measure of cardiovascular health is the concentration of cholesterol in the blood, measured in mmol/L, where lower cholesterol concentrations are associated with improved cardiovascular health. For example, a cholesterol concentration of 3.57 mmol/L would be associated with better cardiovascular health compared to a cholesterol concentration of 6.04 mmol/L.
In this fictitious study, the researcher recruited 21 participants who were classified as being "sedentary" (i.e., they engaged in only low daily activity and did not exercise). These 21 participants were randomly assigned to one of two groups. One group underwent an exercise intervention where participants took part in a 6-month exercise programme consisting of four 1-hour exercise sessions per week. This experimental group was called the "exercise" group. The other group continued with their typical daily activities (i.e., they remained "sedentary"). This group was called the "control" group. After 6 months, the cholesterol concentration of participants (in mmol/L) was measured in the exercise group and the control group.
Note: To ensure that the assumption of independence of observations was met, as discussed earlier, participants could only be in one of these two groups and the two groups did not have any contact with each other.
To determine whether cardiovascular health had improved as a result of the exercise intervention, the researcher ran an independent-samples t-test to determine whether there was a statistically significant difference in mean cholesterol concentration between the exercise group and the control group.
Therefore, in this study the continuous dependent variable is cholesterol concentration and the categorical (dichotomous) independent variable is exercise trial, which has two groups: "exercise" and "control".
R and RStudio
Setup to run the independent-samples t-test using R
R is a very powerful statistical programming language, but it does not come with a spreadsheet-style interface like Microsoft Excel (called "Excel" from this point forward), IBM SPSS Statistics, Stata, Minitab, and other statistical software. This makes data entry a little more challenging, but there are ways to use Excel and another software package called RStudio to make the process easier. Therefore, the three steps below set out how to set up your data to run an independent-samples t-test using R, with the help of Excel and RStudio. We also briefly explain the alternatives if you do not want to use Excel and RStudio.
- STEP ONE
Create your data set in Excel
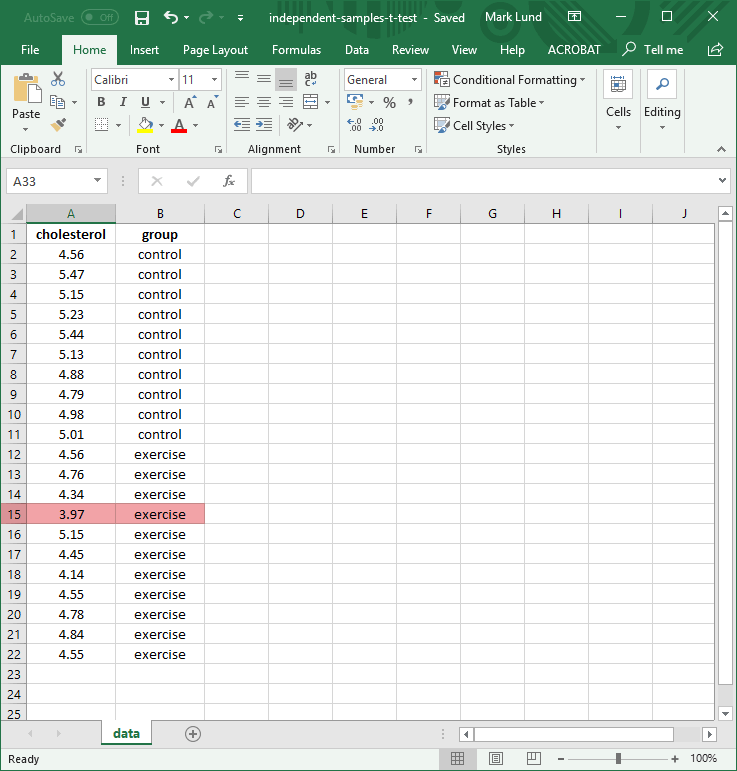
We first show you how to set up your dependent variable and independent variable in Excel in a way that makes it easier to import your data into RStudio. At the end of the data set up process in Excel, your spreadsheet will take the following format:
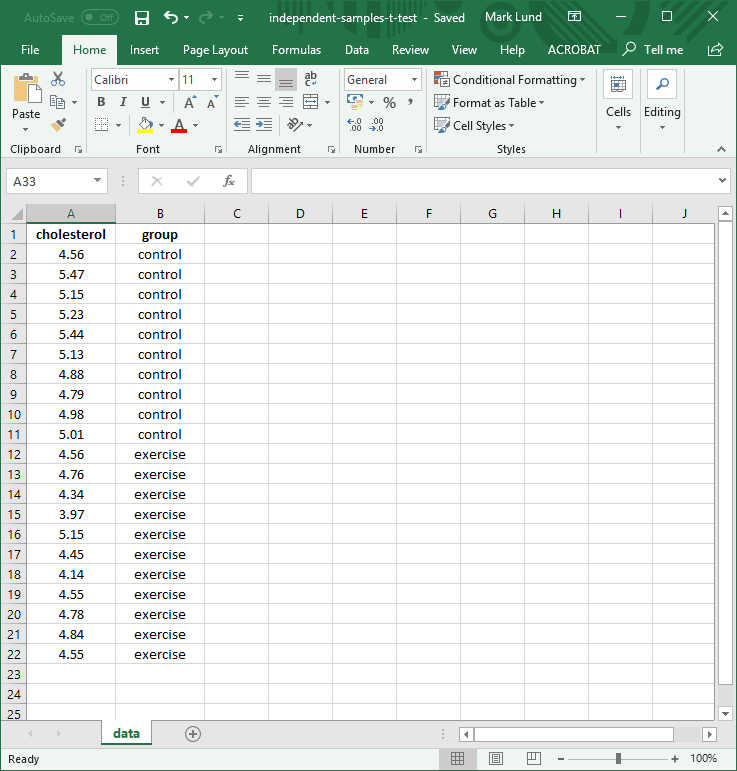
There are many ways to can enter your data into Excel and then import it into RStudio. We are just demonstrating one method that fits with the instructions later in this introductory guide when setting up your data in RStudio. If you would like us to show more data setup options in Excel (including troubleshooting when entering data from Excel in RStudio), please contact us and let us know how we can help.Note: It is also possible to set up your data directly in R rather than using Excel and RStudio. However, R does not have a spreadsheet-style interface and currently does not have an easy way to import Excel files (unlike RStudio). Nonetheless, if you would like us to add a guide to show how to directly enter data into R, please contact us.
- STEP TWO
Install the tidyverse R package into R using RStudio
If you have not (a) used RStudio before, or (b) imported data from Excel into R using RStudio before, you need to install an R package called readxl into R using RStudio. However, we show you how to install an R package called tidyverse because this contains a number of use R packages, including readxl, which allows you to import your data file from Excel into R using RStudio. It is also used to help you carry out an independent-samples t-test using R in RStudio.Note: You may have noticed that we keep referring to "using R in RStudio". This is because although R is a statistical programming language, it is also a software package where you can run R code to carry out statistical analysis. RStudio is simply an interface that you are using to make it easier to manage your data and carry out your analysis. However, you are actually using the R software "within" RStudio. In a sense, RStudio is making it easier for you to "talk to R", which is not as user-friendly as RStudio.
- STEP THREE
Import your data set from Excel into R using RStudio
When your data is set up using the format in Step 1 and you have installed the tidyverse R package in Step 2, you can finally import your data set from Excel into R using RStudio. After completing Step 3 you will be able to start analysing your data using an independent-samples t-test.
Therefore, in the three sections that follow, we first show you how to create your data set in Excel, then explain how to install the tidyverse R package into R using RStudio, before finally showing you how to import your data set from Excel into R using RStudio. If you find any of the following instructions unclear or if there are other guides you would like to see added to Laerd Statistics, please contact us.
STEP ONE
Create your data set in Microsoft Excel
The following five steps will show you how to enter your data in Excel.
Saving your Microsoft Excel file
-
Open Microsoft Excel and save your file. Later we show you how to import this file into RStudio.
Note: If you are unsure how to save files in Microsoft Excel, please contact us and we will add a guide to help.
Setting up your dependent variable
-
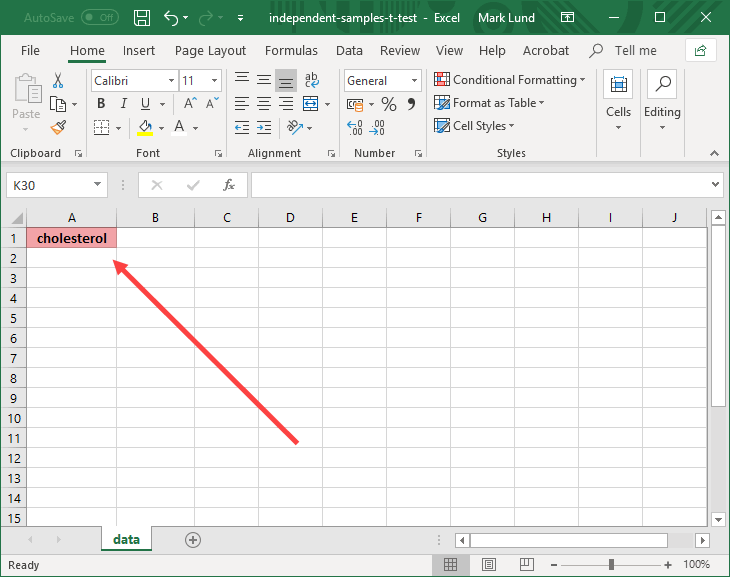
Enter the name of your dependent variable into the first cell of the first column (i.e., along row
 under column
  ). In our example, we entered "cholesterol" to reflect our dependent variable, cholesterol concentration, which is measured in mmol/L, as highlighted below:
Note: The name you give your dependent variable in the first cell of the first column in Excel is what you will use when referring to your dependent variable in RStudio. Therefore, to avoid possible mistakes when working with code in RStudio (e.g., typos), it can help to keep the name you enter into this first cell short or abbreviated (e.g., we entered "cholesterol" rather than "cholesterol_concentration" or "cholesterol_concentration_mmol/L", but could have gone even shorter and entered "chol", for example).
Setting up your independent variable
-
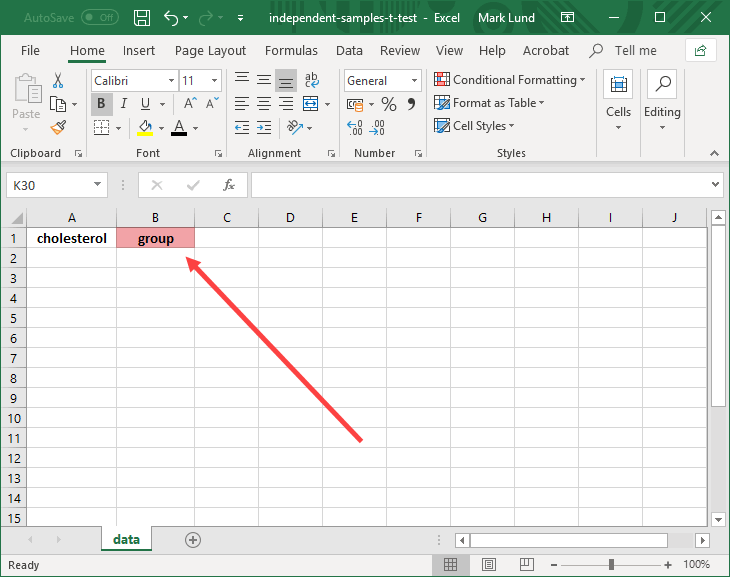
Enter the name of your independent variable in the first cell of the second column (i.e., along row
 under column
  ). In our example, we entered "group" to reflect our independent variable, exercise trial, which has two groups – "control" (i.e., where participants did not undergo an intervention) and "exercise" (i.e., where participants underwent a 6-month exercise training programme) – as highlighted below:
Note: As mentioned in the note above, the name you give your independent variable in the first cell of the second column in Excel is what you will use when referring to your independent variable in RStudio. Therefore, to avoid possible mistakes when working with code in RStudio (e.g., typos), it can help to keep the name you enter into this first cell short or abbreviated (e.g., we entered "group" rather than "exercise trial" to simple reflect that this is the column where we are stating whether a participant was in the "control" group or "exercise" group).
Entering your data
When entering your data into Excel, each row should only include the data for one case, where a case in our example is a participant. However, in your study a case could be an object, animal, cell, or something else, depending on what you are measuring in your research.
Therefore, on row ![]() we entered the data for one of our participants, as shown below:
we entered the data for one of our participants, as shown below:
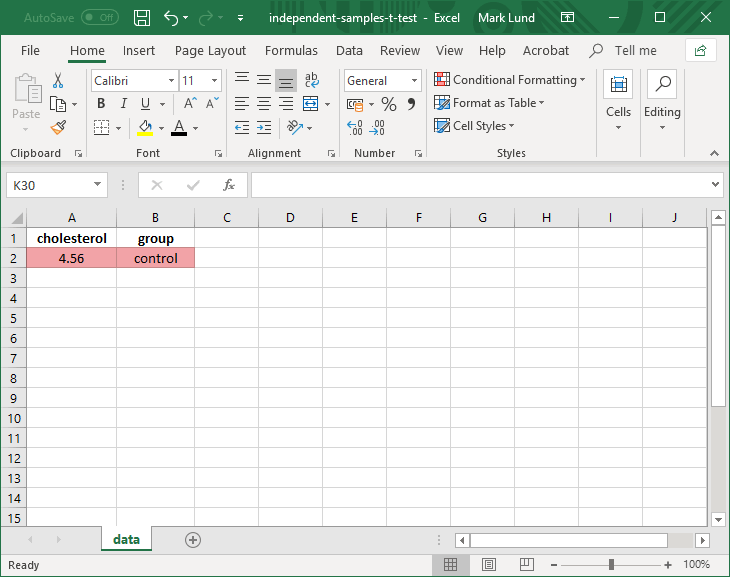
In the example above, the participant in row ![]() had a cholesterol concentration of 4.56 mmol/L and was in the control group. Therefore, we entered "4.56" into the cell under the dependent variable, "cholesterol", and "control" into the cell under the independent variable, "group".
had a cholesterol concentration of 4.56 mmol/L and was in the control group. Therefore, we entered "4.56" into the cell under the dependent variable, "cholesterol", and "control" into the cell under the independent variable, "group".
Note: Please enter the name of your two groups using text (e.g., "control" or "exercise") and not numerical coding (e.g., "1" to represent "control" and "2" to represent "exercise"). Whilst it is possible to use numerical coding rather than text, the instructions to set up your data to run an independent-samples t-test using R in RStudio in this guide are based on text and not numerical coding.
-
Enter the values for your dependent variable into the rows under the first column, "cholesterol", and the names of the two groups of your independent variable in the rows under the second column, "group", as shown below:

Since there were 21 participants in our fictitious example, the data is entered into 21 rows (i.e., rows
 to
to  ).
).Note: Remember that one participant is entered along each row, so the value for the dependent variable for a participant corresponds to the group of the independent variable for that participant. For example, the participant in row
 above had a cholesterol concentration of 3.97 mmol/L and was in the exercise group, so we entered "3.97" into the cell under "cholesterol" in row
  and "exercise" into the cell under "group" in row
  . This is highlighted below:
-
Save your Microsoft Excel file (if you have not already). It is now ready to be imported into RStudio, which we show you how to do later. First, go to the next section where we show you how to install the tidyverse R package into RStudio.
STEP TWO
Install the tidyverse package into R using RStudio
The tidyverse R package consists of a number of useful R packages, including readxl, will allows you to import files from Microsoft Excel into R using RStudio. Therefore, in the five steps that follow we show you how to install the tidyverse R package:
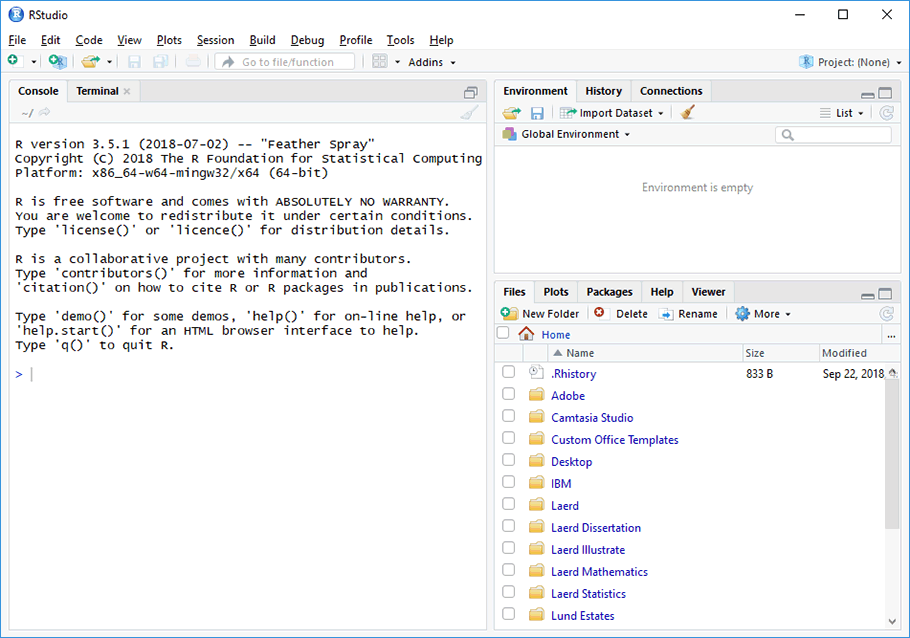
Open RStudio
-
Open RStudio on your computer.
Note: If you have not yet downloaded RStudio onto your computer and you would like us to add a guide to show how to do this, please contact us.
Find the tidyverse R package using RStudio
-
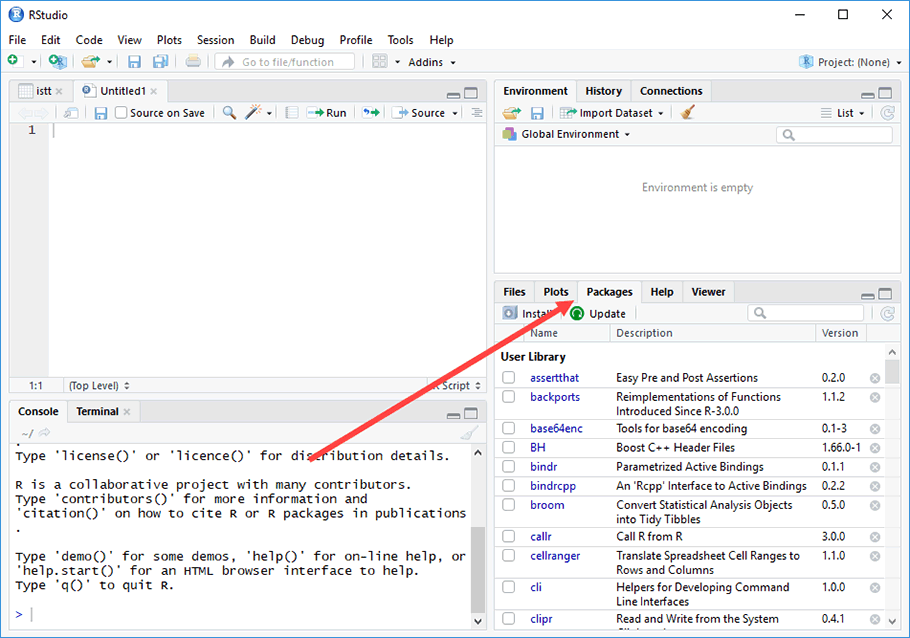
Click on the
 tab. You will be presented with a list of R packages, as shown below:
Note: These R packages will be divided into two sections: (1) first, the User Library, which lists all R packages you have already installed (if any); and (2) the System Library, which lists all R packages installed by default when your installed R.
-
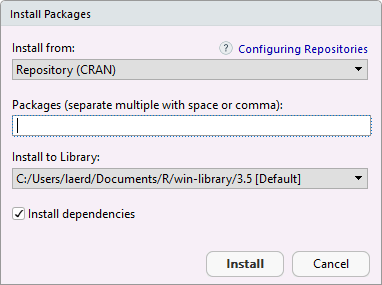
Click on the
 button under the now highlighted
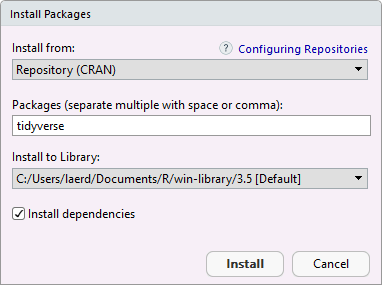
  tab. You will be presented with the Install Packages dialogue box, as shown below:
Install the tidyverse R package into R using RStudio
-
To install the tidyverse R package, which allows you to import Excel files into R using RStudio, but also includes a lot of other useful functions, enter "tidyverse" (without the "quotation marks") into the Packages (separate multiple with space or comma): box, as shown below:
-
Click on the
 button. You will be returned to the RStudio interface, which shows that the tidyverse R package has been installed into R, as highlighted below:
-
After installing the tidyverse R package into R in RStudio, the readxl R package will appear in the list of packages installed under the User Library, as highlighted below:
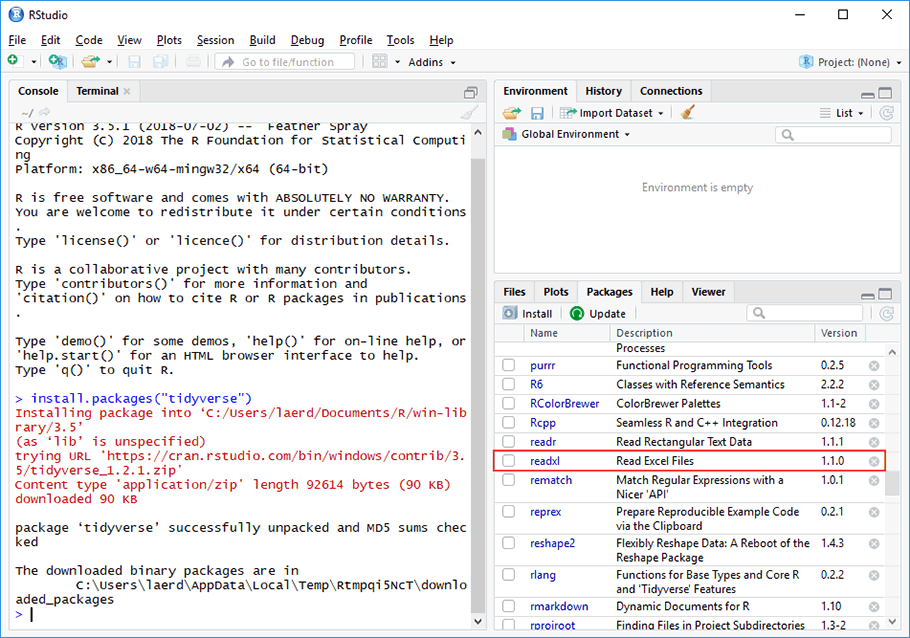
Note: In addition to the readxl R package, other useful R packages will have also been added to the User Library list when installing the tidyverse R package.
Now that you have successfully installed the tidyverse R package into R you can go to the next section where we show you how to import your data from Excel into R using RStudio.
STEP THREE
Import your data from Microsoft Excel into R using RStudio
Assuming you have set up your data using the format in Step 1 and installed the tidyverse R package in Step 2 in the previous section, you can finally import your data set from Excel into R using RStudio. We show you how to do this in the four steps that follow:
-
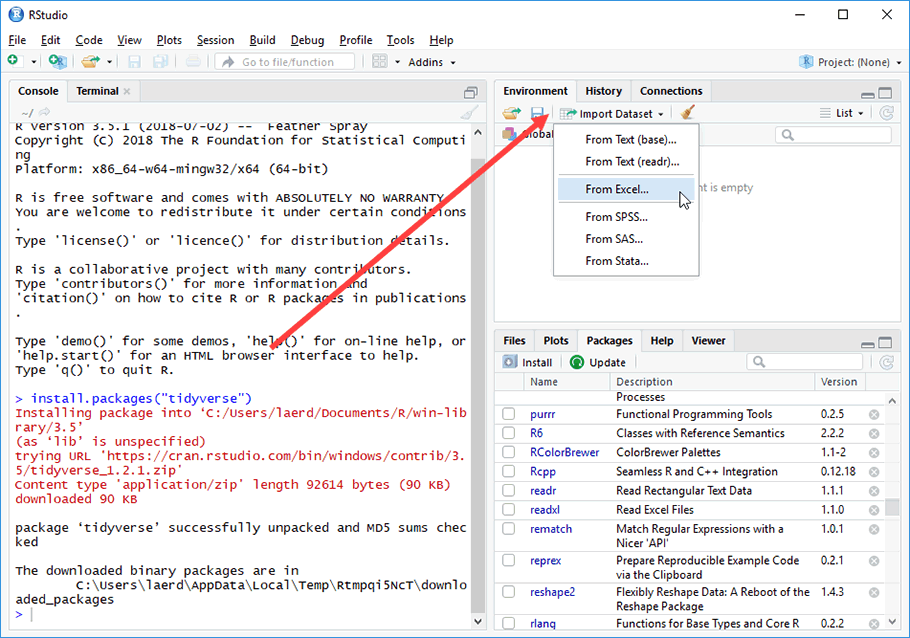
Under the
 tab in RStudio, click on the
  button. In the drop-down menu that appears, click on From Excel…, as shown below:
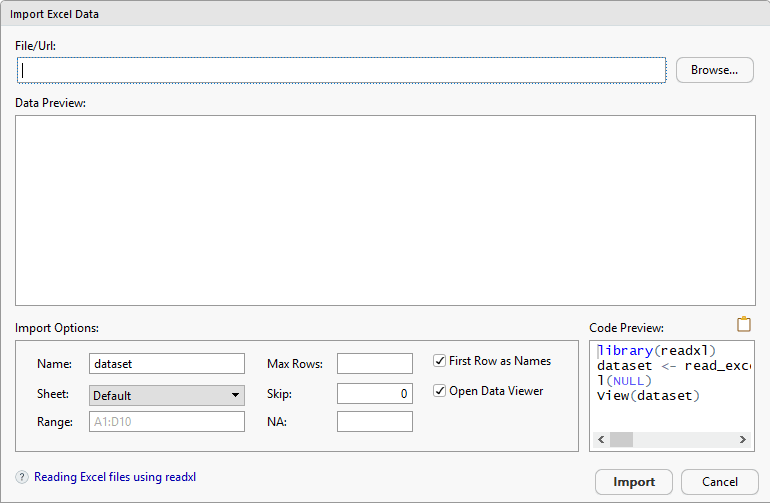
You will be presented with the Import Excel Data dialogue box, as shown below:
-
Click on the
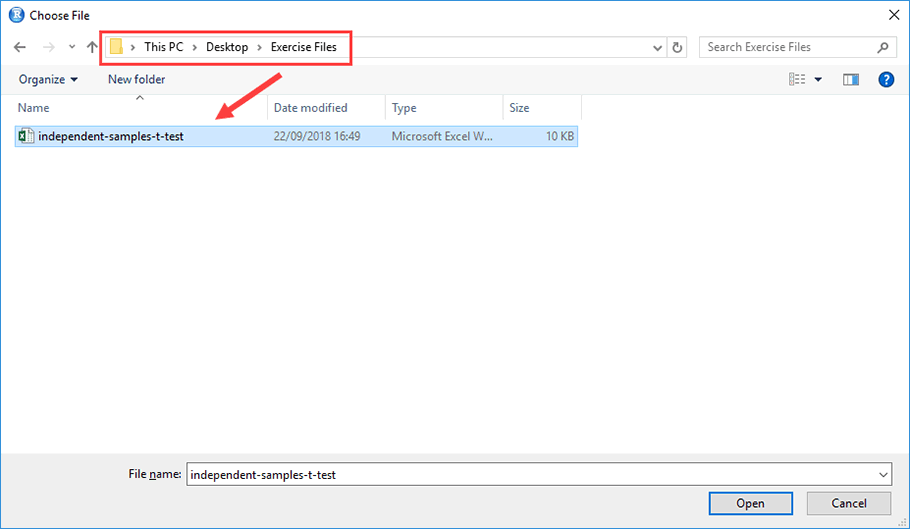
 button, which will open the Choose File dialogue box. You will need to locate the Microsoft Excel file that you created earlier using this dialogue box. Since we saved our example data set in a folder called Exercise Files on our Desktop, our file is highlighted below:
-
After clicking on your Excel file to highlight it, click on the
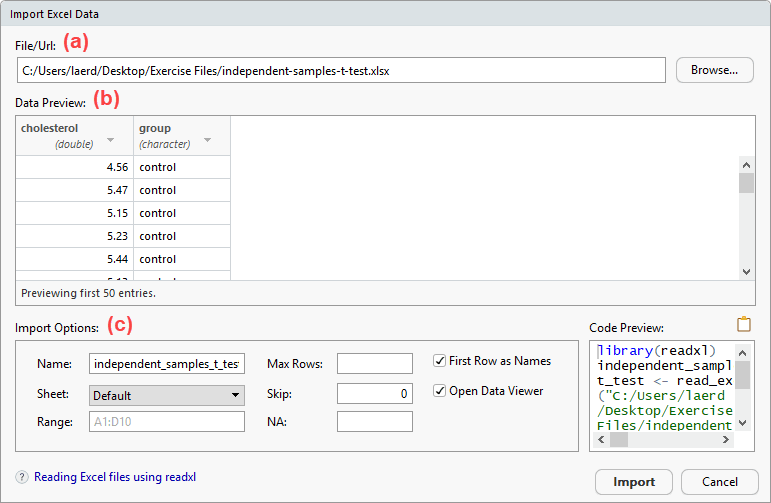
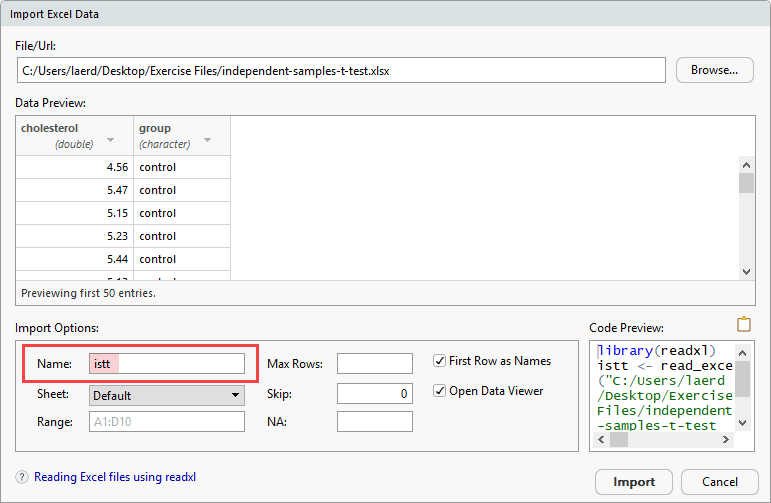
 button. You will be returned to the Import Excel Data dialogue box, as shown below, which will include: (a) the location of the Microsoft Excel file in the File/Url: box; (b) the data to be imported in the –Data Preview:– area; and (c) the options that affect how your data will be imported into RStudio in the –Import Options:– area.
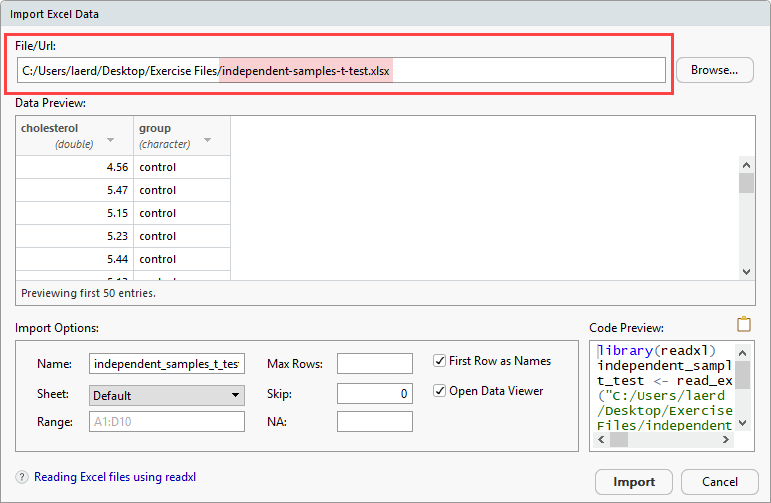
Important: When we created our example independent-samples t-test data set in Excel and saved it, we gave it the name, "independent-samples-t-test". This is reflected in the File/Url: box highlighted below:
When this file is imported into R using RStudio, it is imported as a dataframe. At a basic level, you can think of the dataframe as R’s version of a spreadsheet (e.g., like a spreadsheet in Excel). When you use the t.test() function in R to run an independent-samples t-test later, you will include the name of the dataframe so that R knows what data to run the analysis on.
However, the name of the dataframe is not always the same as the name you gave the file in Excel. For example, RStudio changed the name of our file from "independent-samples-t-test" to "independent_samples_t_test", as highlighted in the Name: box within the –Import Options:– area below:
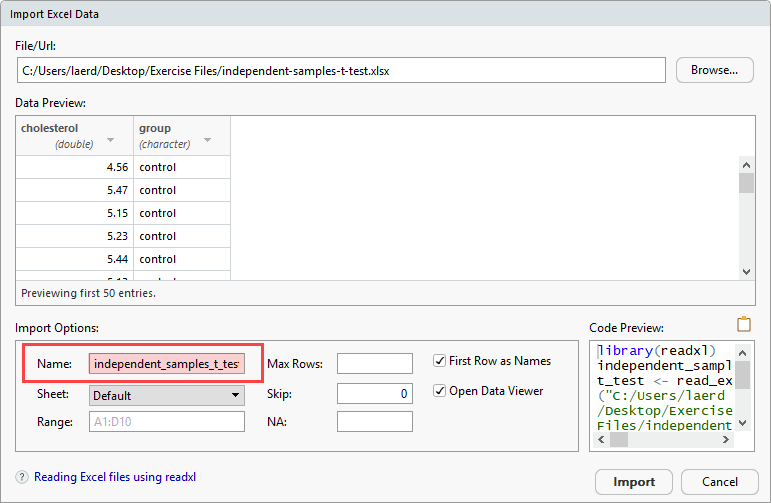
This is important because when you use the t.test() function in R to run an independent-samples t-test, the R code that you enter to indicate which dataframe you are using must be entered exactly as it is written in the Name: box above. Therefore, to avoid any mistakes (e.g., typos), we suggest changing the name of the dataframe to something short and simple. In our example, we changed it to "istt" from "independent_samples_t_test", as highlighted below:
-
Click on the
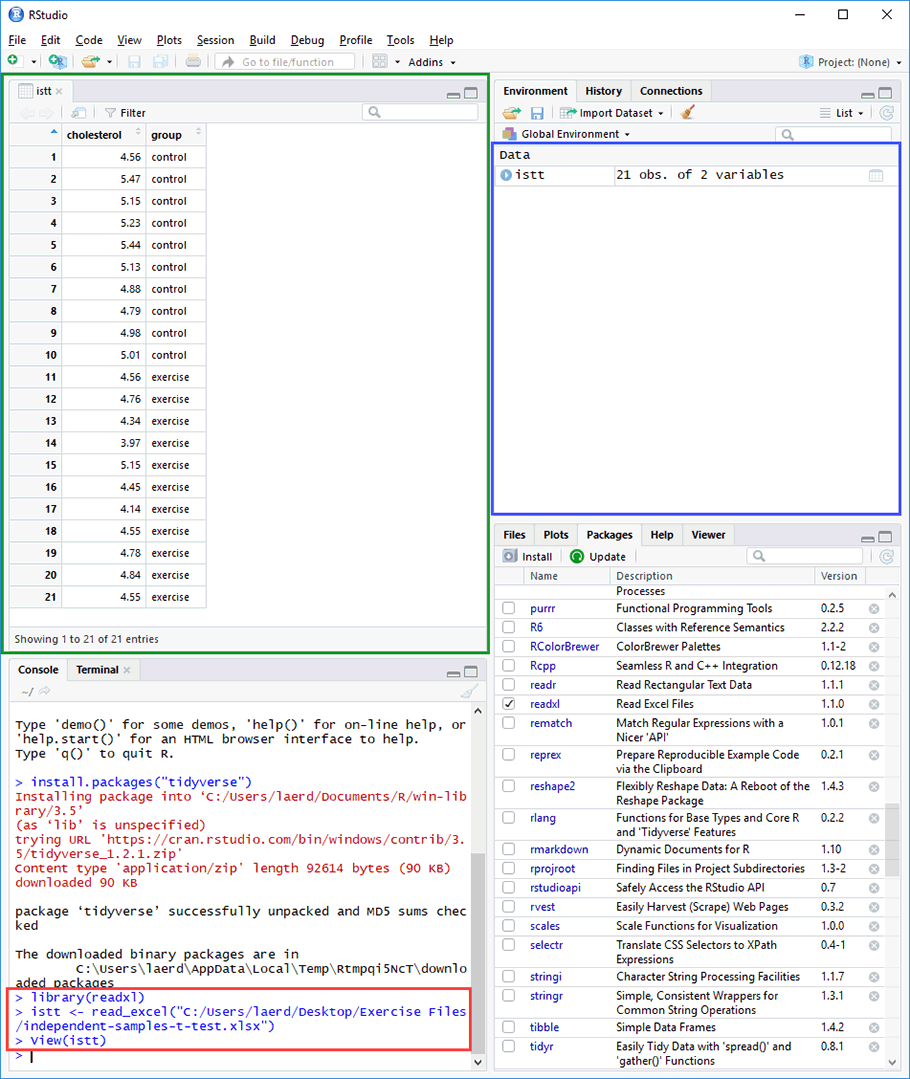
 button. You will be returned to the RStudio interface, which will now include: (a) the data from Excel in the
  window on the top left-hand side (i.e., in the green rectangle below); (b) a description of the data that has been imported in the
  area, including the name of the dataframe (i.e., istt), the number of observations (i.e., sample size) and number of variables (i.e., in the blue rectangle below); and (c) the code stating that the Excel file (i.e., within the independent-samples-t-test.xlsx file) has been imported and is being displayed (i.e., in the red rectangle below).
Your data is now set up correctly in RStudio. In the next page we show you how to run an independent-samples t-test using R in RStudio.