Repeated Measures ANOVA (cont...)
Calculating a Repeated Measures ANOVA
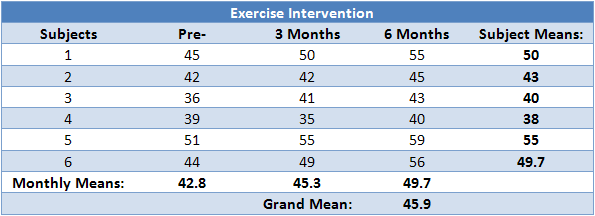
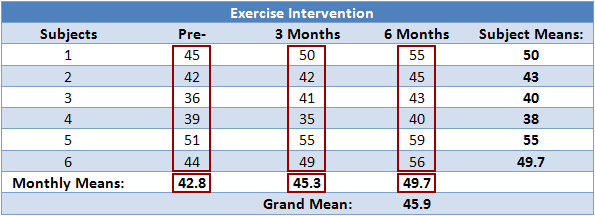
In order to provide a demonstration of how to calculate a repeated measures ANOVA, we shall use the example of a 6-month exercise-training intervention where six subjects had their fitness level measured on three occasions: pre-, 3 months, and post-intervention. Their data is shown below along with some initial calculations:
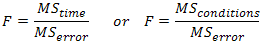
The repeated measures ANOVA, like other ANOVAs, generates an F-statistic that is used to determine statistical significance. The F-statistic is calculated as below:
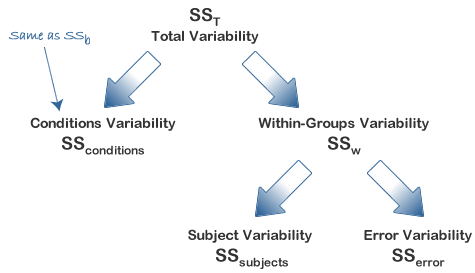
You will already have been familiarised with SSconditions from earlier in this guide, but in some of the calculations in the preceding sections you will see SSconditions sometimes referred to as SStime. They both represent the sum of squares for the differences between related groups, but SStime is a more suitable name when dealing with time-course experiments, as we are in this example. The diagram below represents the partitioning of variance that occurs in the calculation of a repeated measures ANOVA.
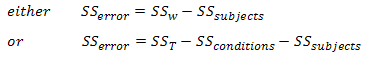
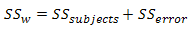
In order to calculate an F-statistic we need to calculate SSconditions and SSerror. SSconditions can be calculated directly quite easily (as you will have encountered in an independent ANOVA as SSb). Although SSerror can also be calculated directly it is somewhat difficult in comparison to deriving it from knowledge of other sums of squares which are easier to calculate, namely SSsubjects, and either SST or SSw. SSerror can then be calculated in either of two ways:
Both methods to calculate the F-statistic require the calculation of SSconditions and SSsubjects but you then have the option to determine SSerror by first calculating either SST or SSw. There is no right or wrong method, and other methods exist; it is simply personal preference as to which method you choose. For the purposes of this demonstration, we shall calculate it using the first method, namely calculating SSw.
Calculating SStime
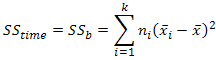
As mentioned previously, the calculation of SStime is the same as for SSb in an independent ANOVA, and can be expressed as:
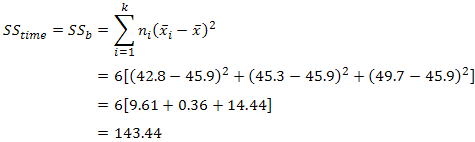
where k = number of conditions, ni = number of subjects under each (ith) condition,  = mean score for each (ith) condition, = grand mean. So, in our example, we have:
Notice that because we have a repeated measures design, ni is the same for each iteration: it is the number of subjects in our design. Hence, we can simply multiple each group by this number. To better visualize the calculation above, the table below highlights the figures used in the calculation:
Calculating SSw
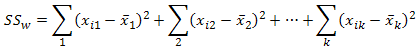
Within-groups variation (SSw) is also calculated in the same way as in an independent ANOVA, expressed as follows:
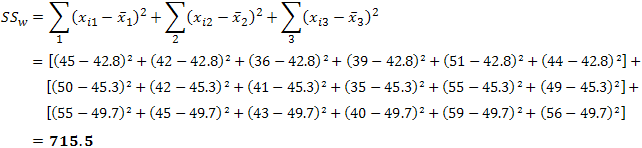
where xi1 is the score of the ith subject in group 1, xi2 is the score of the ith subject in group 2, and xik is the score of the ith subject in group k. In our case, this is:
To better visualize the calculation above, the table below highlights the figures used in the calculation:
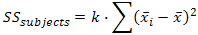
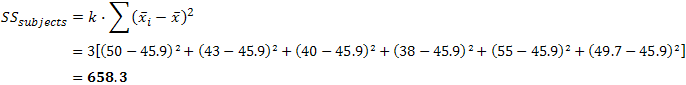
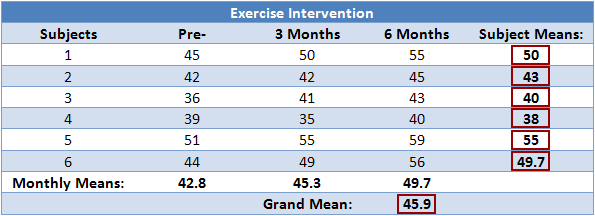
Calculating SSsubjects
As mentioned earlier, we treat each subject as its own block. In other words, we treat each subject as a level of an independent factor called subjects. We can then calculate SSsubjects as follows:
where k = number of conditions, mean of subject i, and = grand mean. In our case, this is:
To better visualize the calculation above, the table below highlights the figures used in the calculation:
Calculating SSerror
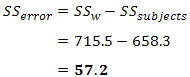
We can now calculate SSerror by substitution:
which, in our case, is:
Determining MStime, MSerror and the F-statistic
To determine the mean sum of squares for time (MStime) we divide SStime by its associated degrees of freedom (k - 1), where k = number of time points. In our case:
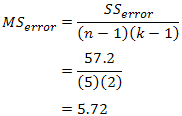
We do the same for the mean sum of squares for error (MSerror), this time dividing by (n - 1)(k - 1) degrees of freedom, where n = number of subjects and k = number of time points. In our case:
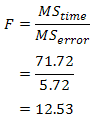
Therefore, we can calculate the F-statistic as:
We can now look up (or use a computer programme) to ascertain the critical F-statistic for our F-distribution with our degrees of freedom for time (dftime) and error (dferror) and determine whether our F-statistic indicates a statistically significant result.
We can now look up (or use a computer programme) to ascertain the critical F-statistic for our F-distribution with our degrees of freedom for time (dftime) and error (dferror) and determine whether our F-statistic indicates a statistically significant result.
How to report the result of a repeated measures ANOVA is shown on the next page.