One-Way MANOVA using Stata
Introduction
The one-way multivariate analysis of variance (i.e., the one-way MANOVA) is used to determine whether there are any differences between two or more independent groups of a categorical (i.e., nominal or ordinal) independent variable in terms of two or more continuous dependent variables. The one-way MANOVA can be thought of as an extension to the one-way ANOVA, which is used when you only have one dependent variable or are interested in analysing only one dependent variable at a time.
For example, you could use a one-way MANOVA to determine whether exam performance in maths and English differed based on test anxiety levels amongst students (i.e., your two dependent variables would be "maths exam performance" and "English exam performance", both measured from 0-100, and your independent variable would be "test anxiety level", which has three groups: "low-stressed students", "moderately-stressed students" and "highly-stressed students"). Alternatively, you could use a one-way MANOVA to determine whether turnover rates of home care registered nurses, medical practice registered nurses and hospital-based registered nurses differed based on perceptions of workplace safety (i.e., your three dependent variables would be "turnover rates of home care registered nurses", "turnover rates of medical practice registered nurses" and "turnover rates of hospital-based registered nurses", and your independent variable would be "perceived workplace safety", based on scores from a 12-question survey that resulted in five groups; those who felt their workplace was "unsafe", "somewhat unsafe", "neither safe nor unsafe", "somewhat safe" and "safe").
Note: If you have two categorical independent variables rather than one, and you want to determine whether there is a two-way interaction effect between these two independent variables, you can run a two-way MANOVA instead of a one-way MANOVA. Alternatively, if you have a continuous covariate in addition to the categorical independent variable, you can run a one-way MANCOVA instead of a one-way MANOVA.
If the one-way MANOVA is statistically significant, this would suggest that there is a difference in the combined dependent variables between the two or more independent groups of the categorical independent variable. Taking the first example above, a statistically significant one-way MANOVA would suggest that there were differences in the combined exam results – that is, the two dependent variables: "maths exam performance" and "English exam performance" – between the three groups: the "low-stressed students", "moderately-stressed students" and "highly-stressed students".
However, the one-way MANOVA is an omnibus test, which means that it cannot tell us where the differences are when the categorical independent variable has three or more groups. For example, it cannot tell us that these two combined exam results where different for "low-stressed students" compared to "highly-stressed students". Similarly, the one-way MANOVA cannot tell us that there was a difference in the combined exam results between the "low-stress students" and the "moderately-stressed students". It can only tell us that at least two of these independent groups were different.
Since the categorical independent variable in your study may have three, four, five or more independent groups, determining which of these independent groups are different from each other is important. Therefore, you can determine where these differences are by carrying out a follow-up analysis (also known as post hoc testing). If you are interested in understanding which independent groups are different at the multivariate level (i.e., where the differences are between the combined dependent variables), you can consider multivariate contrasts. However, if you are interested in understanding which independent groups are different at the univariate level (i.e., where the differences are between each dependent variable separately), you can consider a univariate analysis.
Note: If you would like us to expand this section to explain these two different types of follow-up analysis (i.e., multivariate contrasts and univariate analysis), please contact us.
In this "quick start" guide, we show you how to carry out a one-way MANOVA using Stata, as well as determine whether you have a statistically significant result. However, before we introduce you to this procedure, you need to understand the different assumptions that your data must meet in order for a one-way MANOVA to give you a valid result. We discuss these assumptions next.
Stata
Assumptions
There are nine assumptions that underpin the one-way MANOVA. If any of these nine assumptions are not met, you might not be able to analyse your data using a one-way MANOVA because you might not get a valid result. Since assumptions #1, #2, #3 and #4 relate to your study design and choice of variables, they cannot be tested in Stata. However, you should decide whether your study meets these assumptions before moving on.
- Assumption #1: Your two or more dependent variables should be measured at the interval or ratio level (i.e., it is a continuous variable). Examples of continuous variables include revision time (measured in hours), intelligence (measured using IQ score), exam performance (measured from 0 to 100), weight (measured in kg), and so forth. You can learn more about interval and ratio variables in our article: Types of Variable.
- Assumption #2: Your independent variable (also known as a between-subjects factor) should consist of two or more categorical, independent (unrelated) groups. Examples of categorical variables include gender (e.g., two groups: male and female), ethnicity (e.g., three groups: Caucasian, African American and Hispanic), physical activity level (e.g., four groups: sedentary, low, moderate and high), and profession (e.g., five groups: surgeon, doctor, nurse, dentist, therapist).
- Assumption #3: You should have independence of observations, which means that there is no relationship between the observations in each group or between the groups themselves. For example, there must be different participants in each group with no participant being in more than one group. This is more of a study design issue than something you can test for, but it is an important assumption of the one-way MANOVA.
- Assumption #4: You should have an adequate sample size. Although the larger your sample size the better, for a one-way MANOVA to run, you need to have more cases (e.g., participants) in each group than the number of dependent variables you are analysing. For example, if you had six dependent variables that were being measured in two independent groups (e.g., "males" and "females"), there must be at least six participants in each of the two independent groups for the one-way MANOVA to run (i.e., there must be at least six males and six females).
Fortunately, you can check assumptions #5, #6, #7, #8 and #9 using Stata. However, do not be surprised if your data fails one or more of these assumptions since this is fairly typical when working with real-world data rather than textbook examples, which often only show you how to carry out a one-way MANOVA when everything goes well. However, don’t worry because even when your data fails certain assumptions, there can be a solution to overcome this (e.g., transforming your data or using another statistical test instead). Just remember that if you do not check that your data meets these assumptions or you test for them incorrectly, the results you get when running a one-way MANOVA might not be valid.
- Assumption #5: There should be no univariate or multivariate outliers. First, there can be no (univariate) outliers in each group of the independent variable for any of the dependent variables. This is a similar assumption to the one-way ANOVA, but for each dependent variable that you have in your MANOVA analysis. Univariate outliers are often just called outliers and are the same type of outliers you will have come across if you have conducted t-tests or ANOVAs. We refer to them as univariate in this guide to distinguish them from multivariate outliers. Multivariate outliers are cases which have an unusual combination of scores on the dependent variables. You can detect univariate outliers using boxplots and check for multivariate outliers using a measure called Mahalanobis distance.
- Assumption #6: There should be multivariate normality, which can be partially tested in Stata using the Doornik–Hansen (2008) omnibus test, the Henze–Zirkler’s (1990) consistent test, and tests based on Mardia’s (1970) measure of multivariate kurtosis and skewness. Unfortunately, multivariate normality is a particularly tricky assumption to test for, so it is also useful to test for univariate normality.
- Assumption #7: There should a linear relationship between each pair of dependent variables for each group of the independent variable. If the variables are not linearly related, the power of the test is reduced. You can test for this assumption by plotting a scatterplot matrix for each group of the independent variable.
- Assumption #8: There should be homogeneity of variance-covariance matrices. You can test this assumption using Box's M (1949, 1950) test of equality of covariance. If your data fails this assumption, you may also need to carry out Levene's test of homogeneity of variance to determine where the problem may lie.
- Assumption #9: There is no multicollinearity. Ideally, you want your dependent variables to be moderately correlated with each other. If the correlations are low, you might be better off running separate one-way ANOVAs, and if the correlation(s) are too high (greater than 0.9), you could have multicollinearity. This is problematic for MANOVA and needs to be screened out.
In practice, checking for assumptions #5, #6, #7, #8 and #9 will probably take up most of your time when carrying out a one-way MANOVA. However, Stata provides all the tools you need to do this.
In the section, Test Procedure in Stata, we illustrate the Stata procedure required to perform a one-way MANOVA assuming that no assumptions have been violated. First, we set out the example we use to explain the one-way MANOVA procedure in Stata.
Stata
Example
Test anxiety can affect the academic performance of students, which can be assessed using different types of assessment, such as a verbal tests, exams and coursework. Since students suffer from different levels of test anxiety, a researcher would like to know whether these different levels of test anxiety affect academic performance. In particular, the researcher was interested in assessing academic performance in terms of "English proficiency" (i.e., how well a person has mastered the English language).
To investigate the effect of test anxiety on the academic performance of students, the researcher recruited a random sample of 60 participants to her study. These students were asked to complete a questionnaire designed to measure test anxiety. Based on the results of the questionnaire, 13 students were classified as having "low anxiety", 27 students were classified as having "moderate anxiety", and 20 students were classified as having "high anxiety". The "English proficiency" of these 60 students was measured using three types of assessment: a "verbal test", an "exam", and a piece of "coursework". All three assessments were marked on a scale from 0 (i.e., where no marks were awarded) to 100 (i.e., where the maximum number of marks were awarded).
Therefore, in this example three dependent variables are the "verbal test", "exam" and "coursework", and the independent variable is "test anxiety level", which has three groups: "low anxiety", "moderate anxiety" and "high anxiety" students. The researcher plans to use the one-way MANOVA to determine whether there are any differences in the combined English proficiency scores between the low-, moderate- and high-anxiety students.
Note 1: A one-way MANOVA analysis can be conducted with balanced and unbalanced designs. In the example above, the design is unbalanced because the sample size in each group of the independent variable is unequal (i.e., of the 60 participants, there are 13 low anxiety, 27 moderate anxiety and 20 high anxiety students). Therefore, if the sample size in each group of the independent variable is equal (e.g., of the 60 participants, imagine that there were 20 low anxiety, 20 moderate anxiety and 20 high anxiety students), the design is balanced.
Note 2: In our example, all three dependent variables were measured on the same scale from 0 to 100 (i.e., where 0 indicated that no marks were awarded and 100 indicated that the maximum number of marks were awarded). However, a one-way MANOVA analysis can also be conducted when the measurement scales of the dependent variables are different (e.g., imagine that the verbal test was measured from 0-20, the exam from 0-50 and the coursework from 0-100).
Stata
Setup in Stata
In Stata, you have to create at least three variables for a one-way MANOVA: (a) two or more dependent variables; and (b) one categorical (nominal or ordinal) independent variable. In our example, since we have three dependent variables we created four variables: (1) the dependent variable, verbal_test, to reflect the scores from the "verbal test"; (2) the dependent variable, exam, to reflect the scores from the "exam"; (3) the dependent variable, coursework, to reflect the scores from the piece of "coursework"; and (4) the independent variable, anxiety, which has three independent groups: "low anxiety", "moderate anxiety" and "high anxiety" students. These four variables were entered into the Data Editor (Edit) spreadsheet in Stata, where one column is used for each dependent variable, as shown below:

Published with written permission from StataCorp LP.
Whilst the scores for your dependent variables can simply be entered directly into the Data Editor above, you need to first set up your independent variable correctly using the Manage Value Labels dialogue box, as shown below:

Published with written permission from StataCorp LP.
Therefore, in the Manage Value Labels dialogue box we gave: (a) a value of "1 -- Low" to represent the students who were classified as having "low anxiety"; (b) a value of "2 -- Moderate" to represent the students who were classified as having "moderate anxiety"; and (c) a value of "3 -- High" to represent the students who were classified as having "high anxiety".
Stata
Test Procedure in Stata
In this section, we show you how to analyse your data using a one-way MANOVA in Stata when the nine assumptions in the Assumptions section have not been violated. You can carry out a one-way MANOVA using code or Stata's graphical user interface (GUI). After you have carried out your analysis, we show you how to interpret your results. First, choose whether you want to use code or Stata's graphical user interface (GUI).
Code
The code to carry out a one-way MANOVA on your data takes the form:
manova DependentVariable1 DependentVariable2 DependentVariable3 DependentVariableX = IndependentVariable
This code, when adjusted for our example, is entered into the ![]() box below:
box below:

Therefore, using our example where the dependent variables are verbal_test, exam and coursework, and the independent variable is anxiety, with three groups (coded "Low", "Moderate" and "High"), the required code would be:
manova verbal_test exam coursework = anxiety
Note: By default, Stata assumes that the independent variable(s) you enter into the manova command are categorical variables (i.e., ordinal or nominal variables). As such, you do not need to add the prefix "i." to these variables (e.g., you can simply enter anxiety rather than i.anxiety, as we have done in this example).
Therefore, enter the code manova verbal_test exam coursework = anxiety into the ![]() box and press the "Return/Enter" key on your keyboard.
box and press the "Return/Enter" key on your keyboard.

You can see the Stata output that will be produced here.
Graphical User Interface (GUI)
The three steps required to carry out a one-way MANOVA in Stata are shown below:
- Click Statistics > Multivariate analysis > MANOVA, multivariate regression, and related > MANOVA on the main menu, as shown below:

Published with written permission from StataCorp LP.
You will be presented with the manova - Multivariate analysis of variance and covariance dialogue box, as shown below:
Published with written permission from StataCorp LP.
- Transfer the dependent variables, verbal_test, exam and coursework, into the Dependent variables: box by using the drop-down button. Next, transfer the independent variable, anxiety, into the Model: box, using the drop-down button. You will be presented with the following screen:
Published with written permission from StataCorp LP.
- Click on the button. This will generate the output.


Stata
Stata Output of the One-Way MANOVA
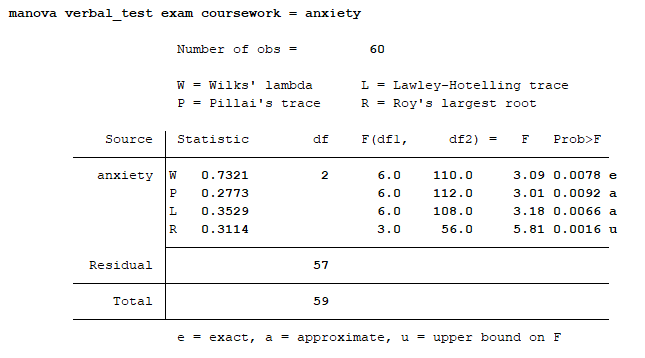
As a reminder from the Introduction, we are using a one-way MANOVA to determine whether there are any differences between two or more independent groups of a categorical (i.e., nominal or ordinal) independent variable in terms of two or more continuous dependent variables. Therefore, in our example that was run in Stata above, the one-way MANOVA was being used to determine whether there were any differences in the combined English proficiency scores between the low-, moderate- and high-anxiety students. After running this procedure using our fictitious data set, Stata generates one table in its one-way MANOVA analysis, as shown below:
Published with written permission from StataCorp LP.
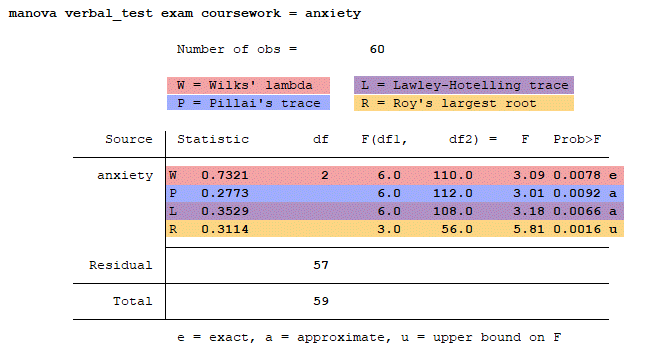
Even though there is only one table, there are actually four one-way MANOVA results produced by Stata, as highlighted below:
Published with written permission from StataCorp LP.
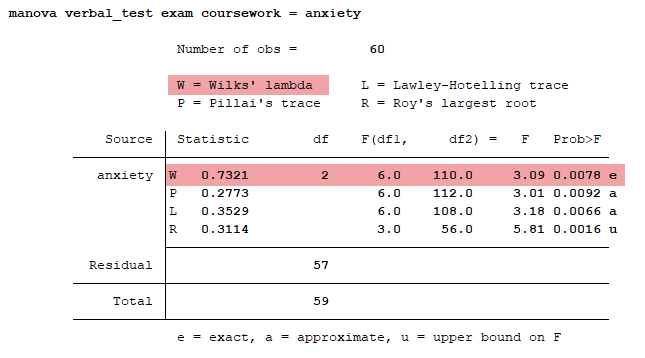
These four one-way MANOVA results are different multivariate statistics that can be used to test the statistical significance of the differences between the independent groups of your categorical variable in terms of your dependent variables. These multivariate statistics are known as Wilks' lambda, Pillai's trace, Lawley-Hotelling trace and Roy's largest root. There are reasons to choose different multivariate statistics and since they do not always provide the same answer, it is important to choose an appropriate multivariate statistic for your study design and data. The most commonly recommended multivariate statistic to use is Wilks' Lambda and this is what will be used in this example, as highlighted below:
Published with written permission from StataCorp LP.
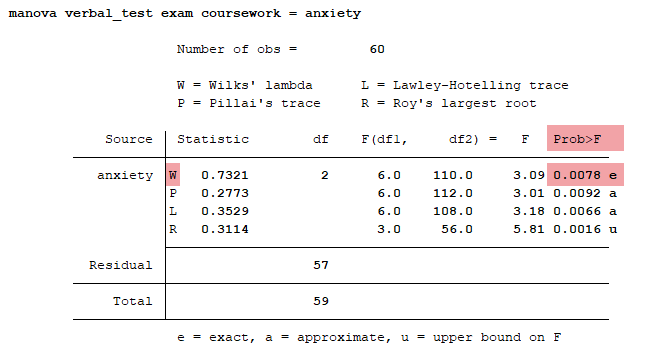
If the one-way MANOVA is statistically significant, you will have a p-value (i.e., in the "Prob>F" column) less than .05 (i.e., p < .05). Alternatively, if the p-value is greater than .05 (i.e., p > .05), the one-way MANOVA is not statistically significant. Therefore, you need to consult the "Prob>F" column along the Wilks' lambda (W) row, as highlighted below:
Published with written permission from StataCorp LP.
You can see from the table above that the value in the "Prob > F" column is .0078. Since .0078 is less than .05 (i.e., .0078 < .05), the one-way MANOVA result is statistically significant. In other words, there is a difference in the combined English proficiency scores between the low-, moderate- and high-anxiety students.
As discussed in the Introduction, the one-way MANOVA is an omnibus test, which means that it cannot tell us where the differences are between our three groups of students. For example, it cannot tell us that these combined assessments of English proficiency where different for "low-anxiety" students compared to "high-anxiety" students. Similarly, the one-way MANOVA cannot tell us that there was a difference in the combined assessments of English proficiency between the "low-anxiety" students and the "moderate-anxiety" students. It can only tell us that at least two of these independent groups were different. Since the categorical independent variable in your study may have three, four, five or more independent groups, determining which of these independent groups are different from each other is important. Therefore, a statistically significant one-way MANOVA result is typically followed by post hoc testing, which aims to determine where these differences are.
Since there are different types of follow-up analysis, you have a choice to make. If you are interested in understanding which independent groups are different at the multivariate level (i.e., where the differences are between the combined dependent variables), you can consider multivariate contrasts. However, if you are interested in understanding which independent groups are different at the univariate level (i.e., where the differences are between each dependent variable separately), you can consider a univariate analysis. Which of these two types of follow-up analysis (i.e., multivariate contrasts or univariate analysis) you should carry out will depend on your goals (i.e., research questions and/or hypotheses) because they will tell you different things about your data. Therefore, if you would like us to expand this section to explain more about these two different types of follow-up analysis, please contact us.
Stata
Reporting the Output of the One-Way MANOVA
When you report the results of your one-way MANOVA it is good practice to include:
- A. An introduction to the analysis you carried out.
- B. Information about your sample (including how many participants were in each of your groups if the group sizes were unequal or there were missing values).
- C. A statement of whether there were statistically significant differences between your groups on the combined dependent variables, including the F-statistics for Wilks' lambda [F], degrees of freedom [df], and significance level, or more specifically, the 2-tailed p-value [Prob > F].
Based on the Stata output above, we could report the results of this study as follows:
- General
A one-way MANOVA was run to determine the effect of test anxiety on academic performance in terms of English proficiency. Three measures of English proficiency were assessed: a verbal test, an exam, and a piece of coursework. Sixty randomly sampled students were allocated to one of three independent groups based on a questionnaire that assessed their test anxiety level, with 13 students being classified as having "low anxiety", 27 students having "moderate anxiety", and 20 students having "high anxiety". There was a statistically significant difference between test anxiety on the combined dependent variables, F(2,57) = 3.09, p = .008.
Note: The p-value has been reported above to 3 decimal places, so p = .008, instead of the 4 decimal places, p = .0078, shown in the "Prob>F" column above.
Bibliography
Box, G. E. P. (1949). A general distribution theory for a class of likelihood criteria. Biometrika, 36, 317–346.
Box, G. E. P. (1950). Problems in the analysis of growth and wear curves. Biometrics, 6, 362–389.
Doornik, J. A., & Hansen, H. (2008). An omnibus test for univariate and multivariate normality. Oxford Bulletin of Economics and Statistics, 70, 927–939.
Henze, N., & Zirkler, B. (1990). A class of invariant consistent tests for multivariate normality. Communications in Statistics, Theory and Methods, 19, 3595–3617.
Mardia, K. V. (1970). Measures of multivariate skewness and kurtosis with applications. Biometrika, 57, 519–530.
Mardia, K. V., Kent, J. T., & Bibby, J. M. (1979). Multivariate analysis. London: Academic Press.
Rencher, A. C., & Christensen, W. F. (2012). Methods of multivariate analysis (3rd ed.). Hoboken, NJ: Wiley.