Kruskal-Wallis H Test using Stata
Introduction
The Kruskal-Wallis H test is a rank-based nonparametric test that can be used to determine if there are statistically significant differences between two or more groups of an independent variable on a continuous or ordinal dependent variable. It is considered the nonparametric alternative to the one-way ANOVA (sometimes also called the "one-way ANOVA on ranks"), and an extension of the Mann-Whitney U test to allow the comparison of more than two independent groups.
For example, you could use a Kruskal-Wallis H test to understand whether salary, measured on a continuous scale, differed based on education level (i.e., your dependent variable would be "salary" and your independent variable would be "education level", which has three independent groups: "undergraduate degree", "graduate degree" and "PhD"). Alternately, you could use the Kruskal-Wallis H test to understand whether attitudes towards tax avoidance, where attitudes are measured on an ordinal scale, differed based on employees' company size (i.e., your dependent variable would be "attitudes towards tax avoidance", measured on a 5-point scale from "completely fair" to "completely unfair", and your independent variable would be "company size", which has three independent groups: "small", "medium" and "large").
It is important to realize that the Kruskal-Wallis H test is an omnibus test statistic and cannot tell you which specific groups of your independent variable are statistically significantly different from each other; it only tells you that at least two groups were different. Since you may have three or more groups in your study design, determining which of these groups differ from each other is important. You can do this using a post hoc test.
This "quick start" guide shows you how to carry out a Kruskal-Wallis H test using Stata, as well as interpret and report the results from this test. However, before we introduce you to this procedure, you need to understand the different assumptions that your data must meet in order for a Kruskal-Wallis H test to give you a valid result. We discuss these assumptions next.
Stata
Assumptions
There are four assumptions that underpin the Kruskal-Wallis H test. If any of these four assumptions are not met, you might not be able to analyse your data using a Kruskal-Wallis H test because you might not get a valid result. Since assumptions #1, #2 and #3 relate to your study design and choice of variables, they cannot be tested for using Stata. However, you should decide whether your study meets these assumptions before moving on.
- Assumption #1: Your two variables should be measured on an ordinal scale or a continuous scale (i.e., an interval or ratio scale). Examples of ordinal variables include Likert scales (e.g., a 7-point scale from "strongly agree" through to "strongly disagree"), amongst other ways of ranking categories (e.g., a 5-point scale for measuring job satisfaction, ranging from "most satisfied" to "least satisfied"; a 4-point scale determining how easy it was to navigate a new website, ranging from "very easy" to "very difficult"; or a 3-point scale explaining how much a customer liked a product, ranging from "Not very much" to "Yes, a lot"). Examples of continuous variables include height (measured in feet and inches), temperature (measured in °C), salary (measured in US dollars), revision time (measured in hours), intelligence (measured using IQ score), reaction time (measured in milliseconds), test performance (measured from 0 to 100), sales (measured in number of transactions per month), and so forth. You can learn more about ordinal and continuous variables in our article: Types of Variable.
- Assumption #2: Your independent variable should consist of two or more categorical, independent (unrelated) groups. Examples of categorical variables include gender (e.g., 2 groups: male and female), ethnicity (e.g., 3 groups: Caucasian, African American and Hispanic), physical activity level (e.g., 4 groups: sedentary, low, moderate and high), and profession (e.g., 5 groups: surgeon, doctor, nurse, dentist, therapist).
- Assumption #3: You should have independence of observations, which means that there is no relationship between the observations in each group or between the groups themselves. For example, there must be different participants in each group with no participant being in more than one group. If you do not have independence of observations, it is likely you have "related groups", which means you will need to use a Friedman test instead of the Kruskal-Wallis H test.
The Kruskal-Wallis H test does not assume normality, can be used with ordinal data, and is much less sensitive to outliers. For these reasons, it is often used when these assumptions have been violated and the use of a one-way ANOVA is inappropriate. However, the Kruskal-Wallis H test is not necessarily free of assumptions since what conclusions you can make will depend on the distribution of the data. This data consideration is considered in Assumption #4, as discussed below:
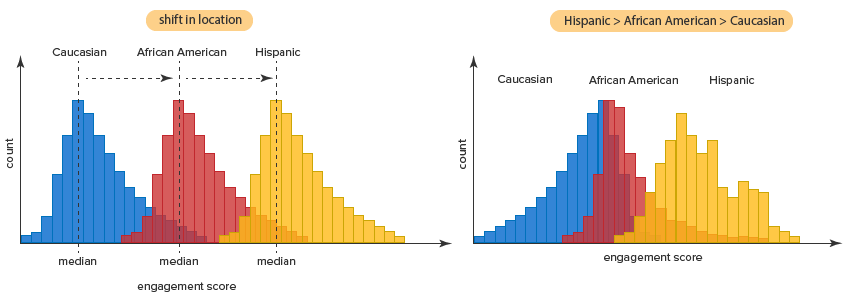
- Assumption #4: In order to know how to interpret the results from a Kruskal-Wallis H test, you have to determine whether the distributions in each group (i.e., the distribution of scores for each group of the independent variable) have the same shape (which also means the same variability). To understand what this means, take a look at the diagram below:

Copyright 2014. Laerd Statistics
In the diagram on the left above, the distribution of scores for the "Caucasian", "African American" and "Hispanic" groups have the same shape. On the other hand, in the diagram on the right above, the distribution of scores for each group are not identical (i.e., they have different shapes and variabilities).
If your distributions have the same shape, you can use Stata to carry out a Kruskal-Wallis H test to compare the medians of your dependent variable (e.g., "engagement score") for the different groups of the independent variable you are interested in (e.g., the groups, Caucasian, African American and Hispanic, for the independent variable, "ethnicity"). However, if your distributions have a different shape, you can only use the Kruskal-Wallis H test to compare mean ranks. Having similar distributions simply allows you to use medians to represent a shift in location between the groups (as illustrated in the diagram on the left above). As such, it is very important to check this assumption or you can end up interpreting your results incorrectly.
In practice, checking for assumption #4 will probably take up a fair amount of your time when carrying out a Kruskal-Wallis H test. However, Stata provides all the tools you need to do this.
In the section, Test Procedure in Stata, we illustrate the Stata procedure required to perform a Kruskal-Wallis H test assuming that no assumptions have been violated. First, we set out the example we use to explain the Kruskal-Wallis H test procedure in Stata.
Stata
Example
An online retailer wants to get the best from its employees, as well as improve their working experience. Currently, employees in the retailer’s order fulfilment centre are not provided with any kind of entertainment whilst they work (e.g., no background music, television, etc.). However, the retailer wants to know whether providing music, which a few employees have requested, would lead to greater productivity, and if so, by how much.
Therefore, the researcher recruited a random sample of 60 employees. This sample of 60 participants was randomly split into three independent groups with 20 participants in each group: (a) a "control group" that did not listen to music; (b) a "treatment group" who listened to music, but had no choice of what they listened to; and (c) a second treatment group who listened to music and had a choice of what they listened to.
The experiment lasted for one month. At the end of the experiment, the "productivity" of the three groups was measured in terms of the "average number of packages processed per hour". Therefore, the dependent variable was "productivity" (measured in terms of the average number of packages processed per hour during the one month experiment), whilst the independent variable was "treatment type", where there were three independent groups: "No music" (control group), "Music - No choice" (treatment group A) and "Music - Choice" (treatment group B).
It was assumed that a one-way ANOVA was inappropriate (e.g., because of non-normal distributions) and, as such, a Kruskal-Wallis H test was used to determine whether there was a statistically significant difference in productivity between the three independent groups.
Note: The example and data used for this guide are fictitious. We have just created them for the purposes of this guide.
Stata
Setup in Stata
In Stata, we separated the three groups for analysis by creating the independent variable, called Music, and gave: (a) a value of "1 -- No music" to the control group; (b) a value of "2 -- Music - No choice" to the treatment group who listened to music, but had no choice of what they listened to; and (c) a value of "3 -- Music - Choice" to the treatment group who listened to music and had a choice of what they listened to, as shown below:

Published with written permission from StataCorp LP.
The scores for the independent variable, Music, were then entered into the left-hand column of the Data Editor (Edit) spreadsheet, whilst the values for the dependent variable, Productivity, were entered into the right-hand column, as shown below:

Published with written permission from StataCorp LP.
Stata
Test Procedure in Stata
In this section, we show you how to analyse your data using a Kruskal-Wallis H test in Stata when the four assumptions in the previous section, Assumptions, have not been violated. You can carry out a Kruskal-Wallis H test using code or Stata's graphical user interface (GUI). After you have carried out your analysis, we show you how to interpret your results. First, choose whether you want to use code or Stata's graphical user interface (GUI).
Stata
Code
In this section we set out the code to carry out a Kruskal-Wallis H test. This code is entered into Stata's ![]() box, as illustrated below:
box, as illustrated below:

Published with written permission from StataCorp LP.
The code to run a Kruskal-Wallis H test on your data takes the form:
kwallis DependentVariable, by(IndependentVariable)
Using our example where the dependent variable is Productivity and the independent variable is Music, the required code would be:
kwallis Productivity, by(Music)
Therefore, enter the following code and press the "Return/Enter" key on your keyboard.

You can see the Stata output that will be produced here.
Stata
Graphical User Interface (GUI)
The three steps required to carry out a Kruskal-Wallis H test in Stata are shown below:
- For Stata 13, click Statistics > Nonparametric analysis > Tests of hypotheses > Kruskal-Wallis rank test on the top menu, as shown below.
Note: For Stata 12 (but also valid for Stata 13), click Statistics > Summaries, tables, and tests > Nonparametric tests of hypotheses > Kruskal-Wallis rank test on the main menu.
Published with written permission from StataCorp LP.
You will be presented with the following kwallis - Kruskal-Wallis equality-of-populations rank test dialogue box:
Published with written permission from StataCorp LP.
- Select the dependent variable, Productivity, from within the Outcome variable: drop-down box and the independent variable, Music, from within the Variable defining groups: drop-down box. You will be presented with the following screen:
Published with written permission from StataCorp LP.
- Click on the button.


You can see the Stata output that will be produced here.
Stata
Output of the Kruskal-Wallis H test in Stata
If you found that after testing assumption #4 the groups had similarly-shaped distributions you can interpret your results in terms of differences in medians. This is what we will assume for this data set. Having run either of the procedures above, your results will be presented under the title, Kruskal-Wallis equality-of-populations rank test, as shown below:
Note: If the groups did not have similarly-shaped distributions, you would interpret your results in terms of differences in mean ranks instead of medians.

Published with written permission from StataCorp LP.
We had ties in our data, so we want to consult the Kruskal-Wallis H test results highlighted in the red rectangle above. The top line (i.e., "chi-squared with ties = 9.470 with 2 d.f.") reports the chi-squared value and the degrees of freedom of the test. The line below this one (i.e., "probability = 0.0088") indicates the statistical significance of the Kruskal-Wallis H test (i.e., the p-value). We can see that the significance level is 0.0088 (i.e., p = .0088), which is below 0.05, and, therefore, there is a statistically significant difference in the median productivity between the three different groups of the independent variable, Music (i.e., "No Music", "Music - No Choice" and "Music - Choice").
Stata
Reporting the output of the Kruskal-Wallis H test
When you report the output of your Kruskal-Wallis H test, it is good practice to include:
- A. An introduction to the analysis you carried out.
- B. Information about your sample (including how many participants were in each of your groups if the group sizes were unequal or there were missing values).
- C. A statement of whether there were statistically significant differences between your groups (including the observed χ2-value, degrees of freedom, and significance level (i.e., p-value)).
Based on the Stata output above, we could report the results of this study as follows:
- General
A Kruskal-Wallis H test was conducted to determine if productivity in a packing facility was different for three groups that either listened to: (a) no music (n = 20); (b) music, but tracks that were not of their choosing (n = 20); and (c) music with tracks they were able to choose (n = 20). A Kruskal-Wallis H test showed that there was a statistically significant difference in productivity between the three groups, χ2(2) = 9.470, p = 0.0088.
In addition to the reporting the results as above, a diagram can be used to visually present your results. For example, you could do this using a box plot. This can make it easier for others to understand your results and is easily produced in Stata.