Recoding Variables in SPSS Statistics (cont...)
Introduction to recoding data into two categories in SPSS Statistics
Similar to the previous page, you may have individual values in your data set (e.g., salaries in US dollars, exam scores from 0 to 100, cholesterol concentration measured in mmol/L) and you want to split these into two categories only (e.g., two categories such as exam scores "between 40 and 100", which might be considered a "pass", and exam scores "between 0 and 39", which might be considered a "fail"). To achieve this, you can create a new variable with these new categories (e.g., the two exam categories above), where these new categories are based on a cut-off between two values (e.g., "40 and above" and "39 and below").
In the sections that follow, we start with the example we use to demonstrating how to recode data into two categories, before showing you how to set up your data in the Variable View and Data View of SPSS Statistics. Next, we set out the SPSS Statistics procedure to recode data into two categories using our example, which also illustrates how the new variable will appear in the Variable View and Data View of SPSS Statistics. Finally, we show the syntax that is run by SPSS Statistics to recode data into two categories, just in case you prefer to use syntax (i.e., code) rather than the graphical user interface (GUI) when working with SPSS Statistics.
Note: If we do not cover the type of recoding you are trying to carry out, please contact us, providing a description of what you are trying to do. We may already have another SPSS Statistics guide to help in our website.
SPSS Statistics
Example used to recode data into two categories
In this example, 12 customers rated how satisfied they were with a new product on a scale of 0 to 10, where 0 was the lowest level of satisfaction and 10 was the highest level of satisfaction, as shown below:
| Customer satisfaction ratings for a new product | ||||||||||||
| Ratings | 3 | 6 | 8 | 9 | 7 | 2 | 10 | 6 | 4 | 8 | 9 | 3 |
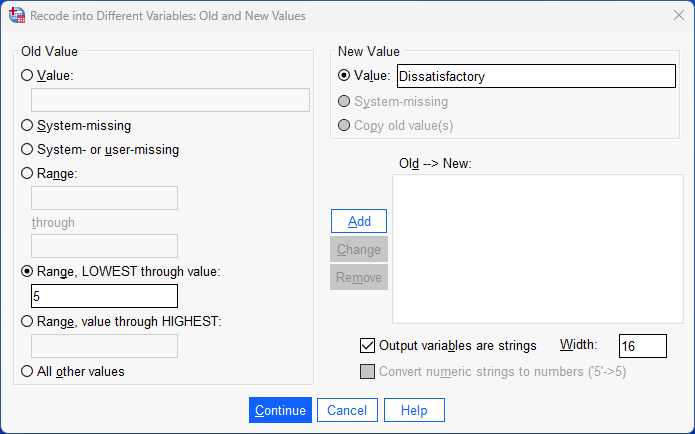
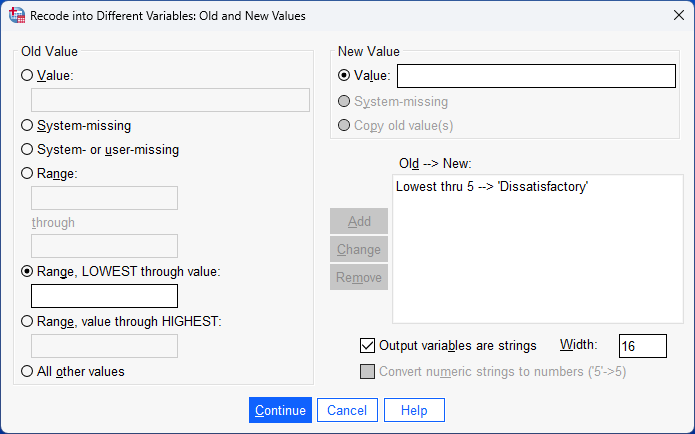
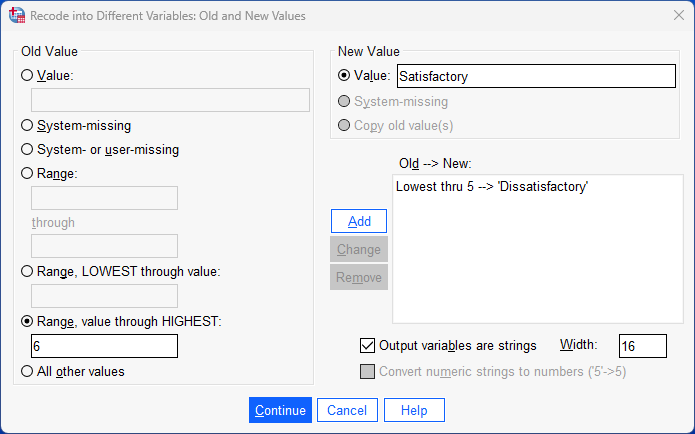
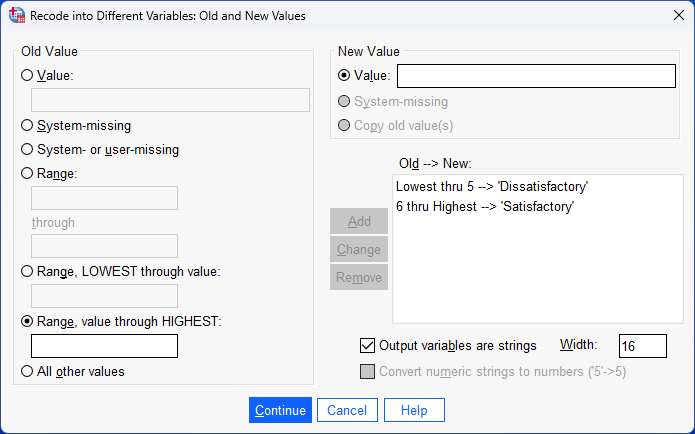
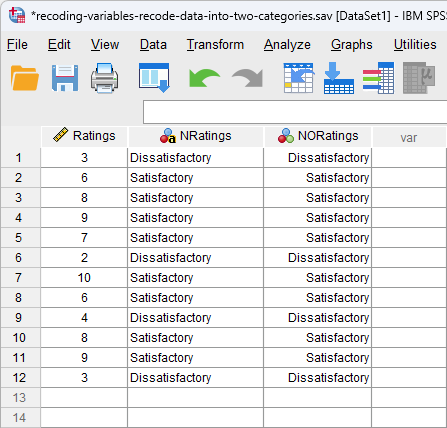
In the table above, the scores ranged from "2", the lowest satisfaction rating, to "10", the highest satisfaction rating. We want to recode the data into two categories such that all customers who gave a satisfaction rating of 5 or lower are coded under the new category, "Dissatisfactory", and all customers who gave a satisfaction rating of 6 or greater are coded under the new category, "Satisfactory", as shown below:
| Recoding satisfaction ratings into two categories | ||||||||||
| New categories | Dissatisfactory | Satisfactory | ||||||||
| Satisfaction rating | 5 or lower | 6 or greater | ||||||||
In the next section, we explain how to set up this data in SPSS Statistics. However, if you already know how to correctly set up your data in SPSS Statistics, you can skip this section and go to the SPSS Statistics procedure to recode data into two categories instead.
SPSS Statistics
Data setup in SPSS Statistics when recoding data into two categories
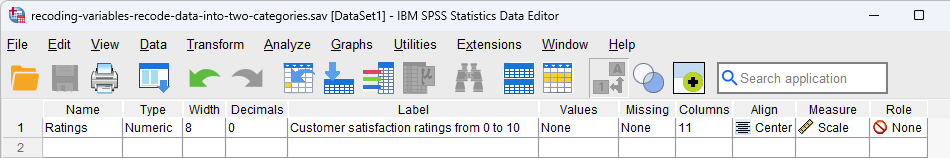
To recode data into two categories, you first have to set up your data using the Variable View and Data View in SPSS Statistics. The Variable View is where you define the types of variables you have and the Data View is where you enter your data for these variables. In this example, there is only one variable, which is are the ratings of the 12 customers, as shown in the Variable View below:
Published with written permission from SPSS Statistics, IBM Corporation.
Our variable, Ratings, is entered on row ![]() in the Variable View above. To set up this variable, we gave it the name, "Ratings", under the
in the Variable View above. To set up this variable, we gave it the name, "Ratings", under the ![]() column, as well as a label, "Customer satisfaction ratings from 0 to 10", under the
column, as well as a label, "Customer satisfaction ratings from 0 to 10", under the ![]() column. In our example, Ratings is a continuous variable, so we selected
column. In our example, Ratings is a continuous variable, so we selected ![]() under the
under the ![]() column. As a result, the Data View will look as follows:
column. As a result, the Data View will look as follows:
Published with written permission from SPSS Statistics, IBM Corporation.
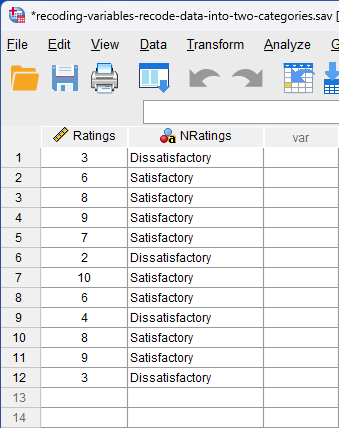
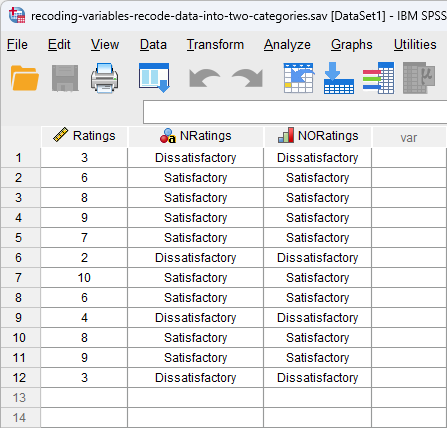
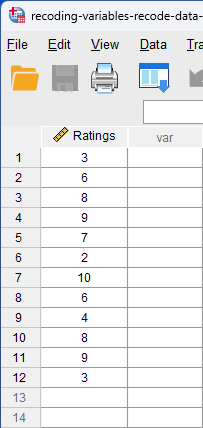
Under the ![]() column of the Data View above, the satisfaction ratings of the new product for each of the 12 customers is entered on a separate row. For example, a satisfaction rating of "3" was entered on row
column of the Data View above, the satisfaction ratings of the new product for each of the 12 customers is entered on a separate row. For example, a satisfaction rating of "3" was entered on row ![]() , a rating of "6" was entered on row
, a rating of "6" was entered on row ![]() , a rating of "8" was entered on row
, a rating of "8" was entered on row ![]() , and so forth. Since these cells will initially be empty, you need to click into the cells to enter your data.
, and so forth. Since these cells will initially be empty, you need to click into the cells to enter your data.