Recoding Variables in SPSS Statistics (cont...)
Introduction to recoding a given range of values in SPSS Statistics
You can group/categorize values in a dataset using a range of values. For example, you may have individual values in your data set (e.g., salaries in US dollars, exam scores from 0 to 100, cholesterol concentration measured in mmol/L) and you want to group these into a number of categories (e.g., four salary "bands", such as salaries "under $20,000", salaries "between $20,001 and $50,000", salaries "between $50,001 and $100,000", and salaries "over $100,000"). To achieve this, you can create a new variable with these new categories (e.g., the four salary ranges above), where these new categories are based on a range of values within your existing variable (e.g., salaries such as "$21,596", "$27,500" and "$29,999" would be included in the new category, salaries "between $20,001 and $50,000").
In the sections that follow, we start with the example we use to demonstrating how to recode a given range of values, before showing you how to set up your data in the Variable View and Data View of SPSS Statistics. Next, we set out the SPSS Statistics procedure to recode a given range of values using our example, which also illustrates how the new variable will appear in the Variable View and Data View of SPSS Statistics. Finally, we show the syntax that is run by SPSS Statistics to recode a given range of values, just in case you prefer to use syntax (i.e., code) rather than the graphical user interface (GUI) when working with SPSS Statistics.
Note: If we do not cover the type of recoding you are trying to carry out, please contact us, providing a description of what you are trying to do. We may already have another SPSS Statistics guide to help in our website.
SPSS Statistics
Example used to recode a given range of values
In this example, the scores of 10 students in an exam were recorded on a scale of 0 to 100 marks, as shown below:
| Examination scores of 10 students | ||||||||||
| Scores | 58 | 86 | 74 | 70 | 79 | 60 | 35 | 42 | 55 | 91 |
In the table above, the scores ranged from "35", the lowest score, to "91", the highest score. We want to recode the data into the following ranges:
| Recoding examination scores into ranges | ||||||||||
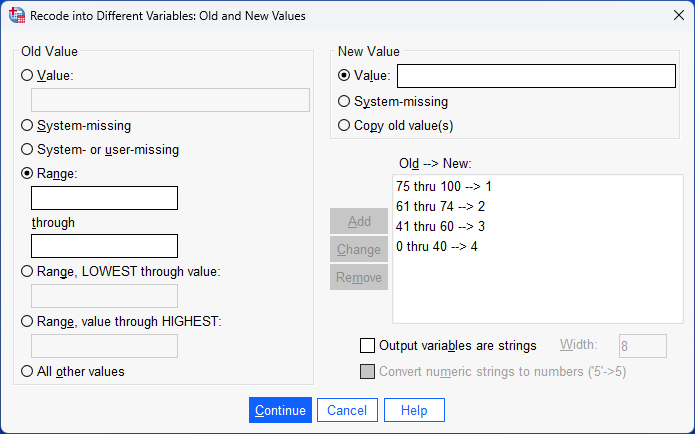
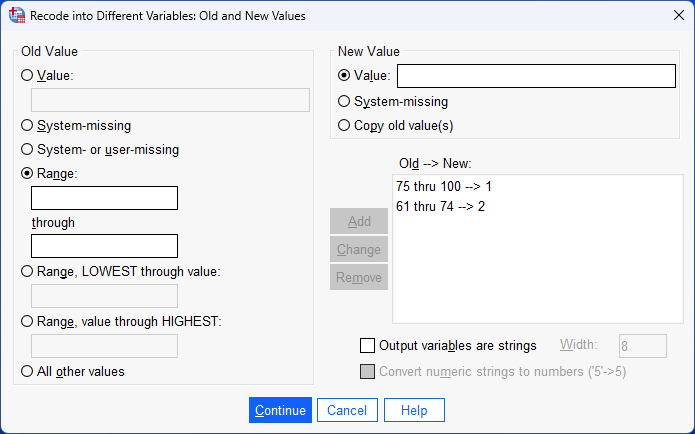
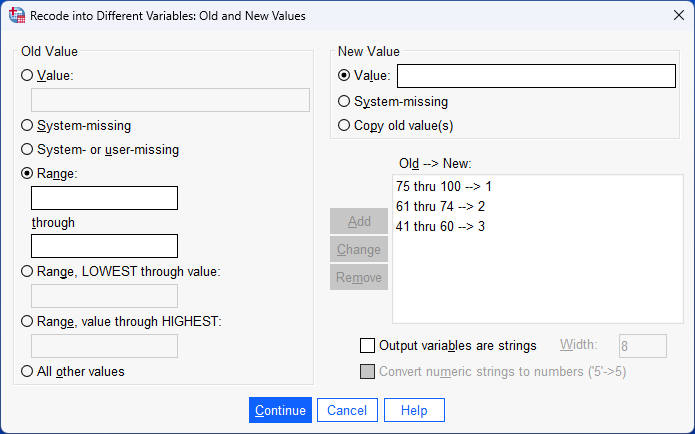
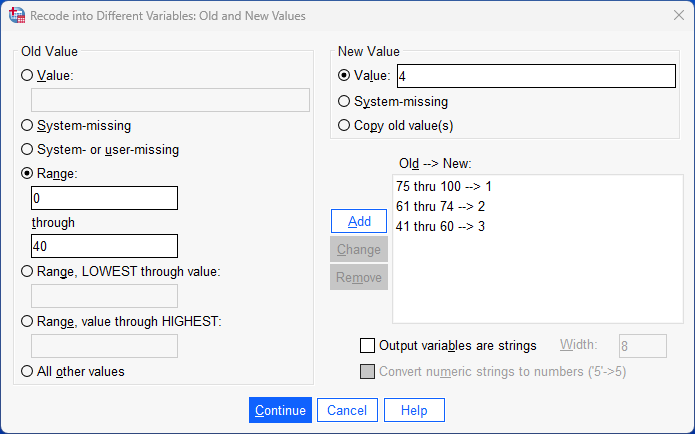
| New coding | 1 | 2 | 3 | 4 | ||||||
| Exam scores between | 75-100 | 61-74 | 41-60 | 0-40 | ||||||
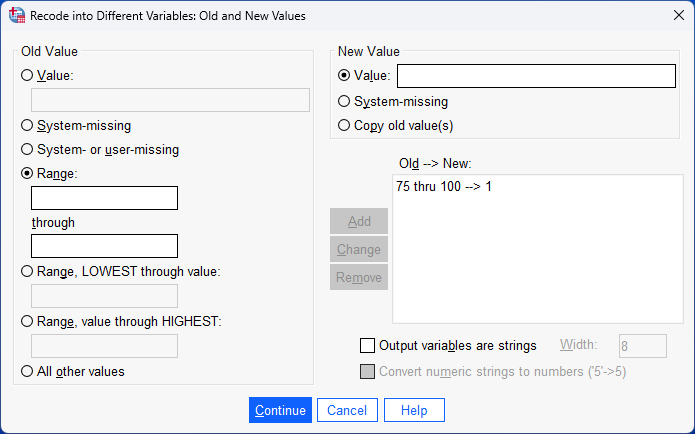
In the table above, a code of "1" will be given to exam scores "between 75 and 100" (i.e., "1" = "75-100"), a code of "2" will be given to exam scores "between 61 and 74" (i.e., "2" = "61-74"), a code of "3" will be given to exam scores "between 41 and 60" (i.e., "3" = "41-60") and a code of "4" will be given to exam scores "between 0 to 40" (i.e., "4" = "0-40").
In the next section, we explain how to set up this data in SPSS Statistics. However, if you already know how to correctly set up your data in SPSS Statistics, you can skip this section and go to the SPSS Statistics procedure to recode a given range instead.
SPSS Statistics
Data setup in SPSS Statistics when recoding a given range of values
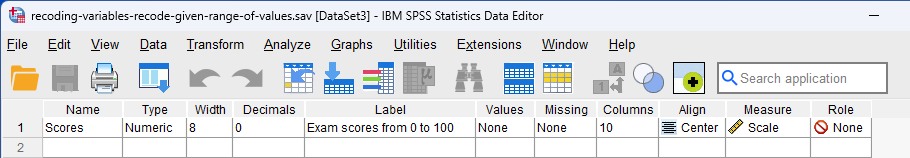
To recode a given range of values, you first have to set up your data using the Variable View and Data View in SPSS Statistics. The Variable View is where you define the types of variables you have and the Data View is where you enter your data for these variables. In this example, there is only one variable, which is the exam scores of the 10 students, as shown in the Variable View below:
Published with written permission from SPSS Statistics, IBM Corporation.
Our variable, Scores, is entered on row ![]() in the Variable View above. To set up this variable, we gave it the name, "Score", under the
in the Variable View above. To set up this variable, we gave it the name, "Score", under the ![]() column, as well as a label, "Exam scores from 0 to 100", under the
column, as well as a label, "Exam scores from 0 to 100", under the ![]() column. In our example, Scores is a continuous variable, so we selected
column. In our example, Scores is a continuous variable, so we selected ![]() under the
under the ![]() column. As a result, the Data View will look as follows:
column. As a result, the Data View will look as follows:
Published with written permission from SPSS Statistics, IBM Corporation.
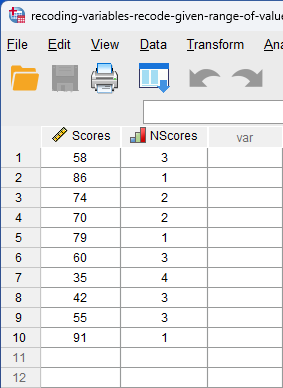
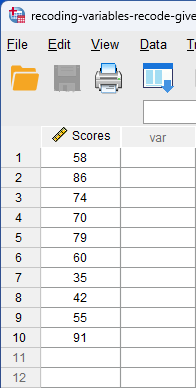
Under the ![]() column of the Data View above, the exam score for each of the 10 students is entered on a separate row. For example, the score of "58" was entered on row
column of the Data View above, the exam score for each of the 10 students is entered on a separate row. For example, the score of "58" was entered on row ![]() , the score of "86" was entered on row
, the score of "86" was entered on row ![]() , the score of "74" was entered on row
, the score of "74" was entered on row ![]() , and so forth. Since these cells will initially be empty, you need to click into the cells to enter your data.
, and so forth. Since these cells will initially be empty, you need to click into the cells to enter your data.