McNemar's test using SPSS Statistics
Introduction
The McNemar test is used to determine if there are differences on a dichotomous dependent variable between two related groups. It can be considered to be similar to the paired-samples t-test, but for a dichotomous rather than a continuous dependent variable. However, unlike the paired-samples t-test, it can be conceptualized to be testing two different properties of a repeated measure dichotomous variable, as is explained below. The McNemar test is used to analyze pretest-posttest study designs, as well as being commonly employed in analyzing matched pairs and case-control studies. If you have more than two repeated measurements, you could use Cochran's Q test.
For example, you could use the McNemar test to determine whether the proportion of participants who had low self-esteem (as opposed to high self-esteem) before a series of counselling sessions (i.e., an intervention) decreased after the intervention (i.e., your dependent variable would be "level of self-esteem", which has two categories: "low" and "high"). Alternately, you could use the McNemar's test to determine whether the proportion of participants who felt safe (yes or no) differed when wearing a cycling helmet as opposed to wearing no cycling helmet (i.e., the dependent variable would be "sense of safety", which has two categories: "safe" and "not safe").
This "quick start" guide shows you how to carry out a McNemar's test using SPSS Statistics, as well as interpret and report the results from this test. However, before we introduce you to this procedure, you need to understand the different assumptions that your study design must meet in order for a McNemar's test to be an appropriate choice of test. We discuss these assumptions next.
SPSS Statistics
Assumptions of McNemar's test
The McNemar's test has three assumptions that must be met. If these assumptions are not met, you cannot use a McNemar's test, but may be able to use another statistical test instead. Therefore, in order to run a McNemar's test, you need to check that your study design meets the following three assumptions:
- Assumption #1: You have one categorical dependent variable with two categories (i.e.,a dichotomous variable) and one categorical independent variable with two related groups. Examples of dichotomous variables include perceived safety (two groups: "safe" and "unsafe"), exam performance (two groups: "pass" and "fail"), preferred choice of cereal brand (two groups: "brand A" and "brand B"), feeling of seasickness (two groups: "yes" and "no"), level of exhaustion (two groups: "low" and "high"), use of safety equipment (two groups: "uses safety helmet" and "doesn't use safety helmet), skin cream effectiveness (two groups: "rash" and "no rash"), and so forth. You can learn more about dichotomous variables in our article: Types of Variable. Having an independent variable with two related groups indicates that you have a pretest-posttest, matched pairs or case-control study design.
- Assumption #2: The two groups of your dependent variable must be mutually exclusive. This means that no groups can overlap. In other words, a participant can only be in one of the two groups; they cannot be in both groups at the same time. For example, imagine you were using a McNemar's test to determine whether the proportion of participants who passed an exam (as opposed to failing the exam) before a two week revision period (i.e., an intervention) increased after the intervention (i.e., your dependent variable would be "exam performance", which has two categories: "pass" and "fail"). When a participant took the exam before the two week revision period, they could have only "passed" it or "failed" it. They could not pass and fail at the same time (e.g., they either got 60 out of 100 marks and above, which was a "pass", or 59 marks and below, which was a "fail"). Similarly, after the two week revision period, the participant could still only either pass or fail the exam.
- Assumption #3: The cases (e.g., participants) are a random sample from the population of interest. However, in practice, this is not always how sampling took place.
If your study design does not meet these three assumptions, you cannot use a McNemar's test, but you may be able to use another statistical test instead (learn more about our Statistical Test Selector if this is the case). However, assuming that you are using the correct test, we show you how to analyze your data using McNemar's test later in the Test Procedure in SPSS Statistics section. First, we introduce you to the example we use in this guide.
SPSS Statistics
Example used in this guide
A researcher wanted to investigate the impact of an intervention on smoking. In this hypothetical study, 50 participants were recruited to take part, consisting of 25 smokers and 25 non-smokers. All participants watched an emotive video showing the impact that deaths from smoking-related cancers had on families. Two weeks after this video intervention, the same participants were asked whether they remained smokers or non-smokers.
Therefore, participants were categorized as being either smokers or non-smokers before the intervention and then re-assessed as either smokers or non-smokers after the intervention. Due to the same participants being measured twice, we have paired-samples. We also have a dependent variable that is dichotomous with two mutually exclusive categories (i.e., "smoker" and "non-smoker"). As a result, a McNemar's test is the appropriate choice to analyze the data.
SPSS Statistics
Data setup in SPSS Statistics to carry out McNemar's test
For a McNemar's test, you will have either two or three variables:
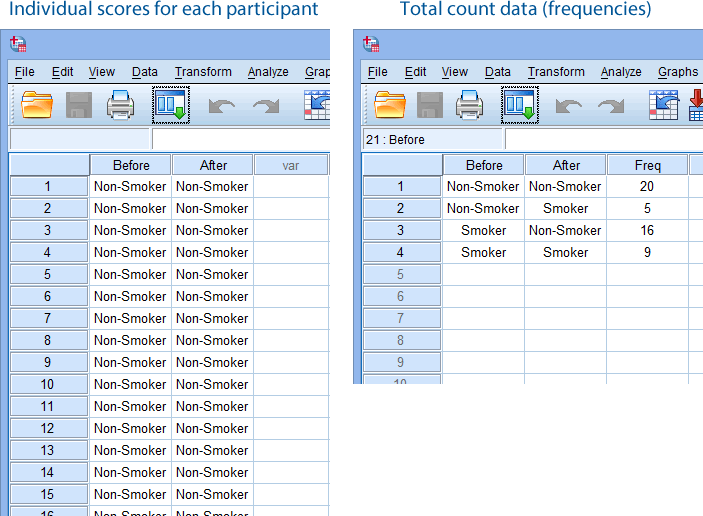
(1) The dichotomous responses for the first of your related groups (e.g., Before, which reflects whether participants were "Non-Smokers" or "Smokers" before the video intervention);
(2) The dichotomous responses for the second of your related groups (e.g., After, which reflects whether participants were "Non-Smokers" or "Smokers" after the video intervention); and
(3) The frequencies (i.e., total counts) for the four possible paired combinations: (a) "Non-Smoker" before and after the intervention; (b) "Non-Smoker" before the intervention, but a "Smoker" after the intervention; (c) "Smoker" before and after the intervention; and (d) "Smoker" before the intervention, but a "Non-Smoker" after the intervention. This is captured in the variable, Freq.
In the diagram below, we show you how you would have set up your data in the Data View of SPSS Statistics if you had entered your data using: (a) the individual scores for each participant (shown in the diagram on the left below), where you only have two variables; or (b) total count data, also known as frequencies (shown in the diagram on the right below), where you have three variables.

Published with written permission from SPSS Statistics, IBM Corporation.
If you are unsure how to correctly enter these variables into the Variable View and Data View of SPSS Statistics so that you can carry out your analysis, we show you how to do this in our enhanced McNemar's test guide. Just remember that if you have entered your data using total count data (i.e., frequencies), shown in the diagram on the right above, you will also have to weight your cases before you can analyze your data (i.e., this is an additional procedure in SPSS Statistics). You can learn about our enhanced data setup content in general on our Features: Data Setup page or subscribe to Laerd Statistics to access our enhanced McNemar's test guide.
SPSS Statistics
SPSS Statistics procedure to carry out McNemar's test
The three steps below show you how to analyze your data using a McNemar's test in SPSS Statistics. We show you the Legacy Dialogs > 2 Related Samples procedure in SPSS Statistics to run a McNemar's test below because this can be used with a wide range of versions of SPSS Statistics. However, you can also run a McNemar's test using the Nonparametric Tests > Related Samples procedure in SPSS Statistics, which is available for versions 18 to 30 and the subscription version of SPSS Statistics. This Nonparametric Tests > Related Samples procedure provides additional statistics and more graphical options than the Legacy Dialogs > 2 Related Samples procedure. Therefore, we show you how to run the Nonparametric Tests > Related Samples procedure and interpret and report the output from it in our enhanced Wilcoxon signed-rank test guide. You can access the enhanced Wilcoxon signed-rank test guide by subscribing to Laerd Statistics.
Note: The procedure that follows is identical for SPSS Statistics versions 17 to 30, as well as the subscription version of SPSS Statistics, with version 30 and the subscription version being the latest versions of SPSS Statistics. However, in version 27 and the subscription version, SPSS Statistics introduced a new look to their interface called "SPSS Light", replacing the previous look for versions 26 and earlier versions, which was called "SPSS Standard". Therefore, if you have SPSS Statistics versions 27 to 30 (or the subscription version of SPSS Statistics), the images that follow will be light grey rather than blue. However, the procedure is identical.
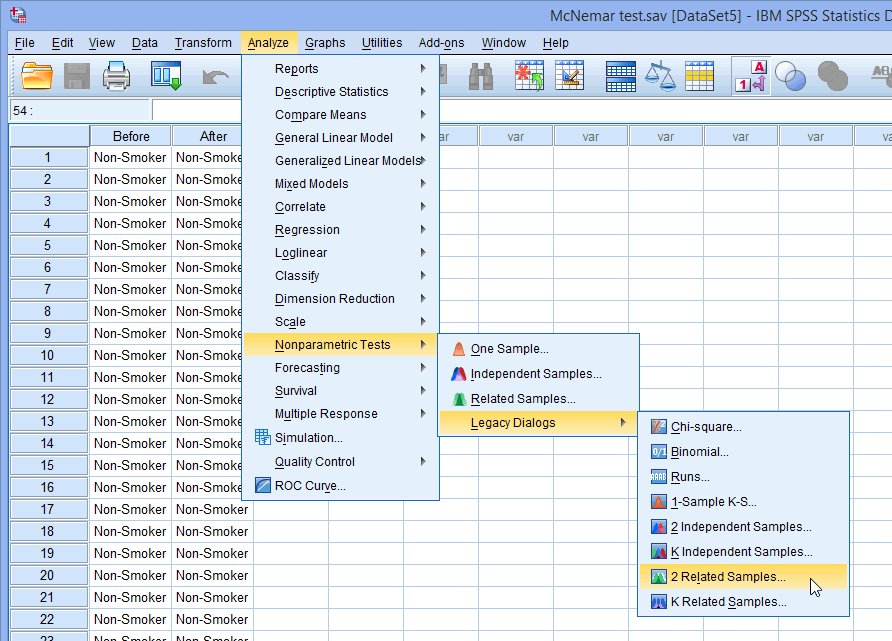
- Click Analyze > Nonparametric Tests > Legacy Dialogs > 2 Related Samples... on the main menu, as shown below:
Published with written permission from SPSS Statistics, IBM Corporation.
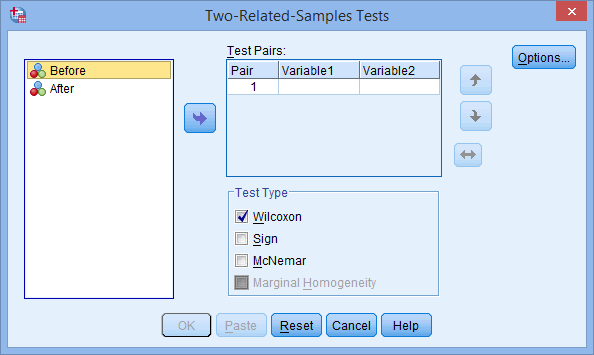
You will be presented with the Two-Related-Samples Tests dialogue box, as shown below:
Published with written permission from SPSS Statistics, IBM Corporation.
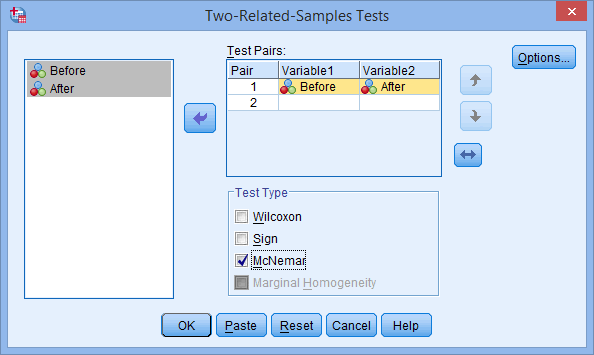
- Transfer the variables Before and After into the Test Pairs: box. To do this, highlight both variables by clicking on one (e.g., Before), then holding down the shift-key, click the other variable (e.g., After). Now, click on the button. You will end up with a screen similar to the one below:
Published with written permission from SPSS Statistics, IBM Corporation.
Explanation: The Test Pairs: box is where you enter the dependent variable(s) you want to analyze. You can transfer more than one dependent variable into this box to analyze many dependent variables at the same time.
Note: By default, SPSS Statistics uses a statistical significance level of .05 and corresponding 95% confidence interval. This equates to declaring statistical significance at the p < .05 level. If you need to change these values in line with your study design (e.g., a statistical significance level of .01 and corresponding 99% confidence interval), you can only do this using SPSS Statistics' newer nonparametric procedure, which provides far more options than the legacy procedure above. We show you how to use the newer nonparametric procedure in our enhanced McNemar's test guide.
- Click on the button to generate the output.
Now that you have run the McNemar's test procedure, we show you how to interpret and report your results.
SPSS Statistics
Interpreting the SPSS Statistics output from McNemar's test
SPSS Statistics generates two main tables of output for McNemar's test when using the Legacy Dialogs > 2 Related Samples procedure: the Crosstabulation table and Test Statistics table. These are discussed in turn below:
Crosstabulation Table
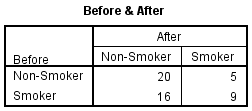
It is important when reporting a McNemar's test result that you also interpret and report descriptive statistics in order to get a 'feel' for your data, as well as to provide an appropriate description of your data. One important measure that we can report is the proportion of participants that were non-smokers both prior to and after the intervention. This is illustrated in the results generated in the Crosstabulation table (called the Before & After table in our example), as shown below:
Published with written permission from SPSS Statistics, IBM Corporation.
Note: You will notice that the table is named after the two variables in our analysis (i.e., Before and After). As such, unless you are using the same variable names as in this example, your table will have a different title reflecting the names of the variables in your analysis.
Consulting the bottom-left cell first, you can see that there were 16 participants that were originally smokers, but following the intervention, they became non-smokers. In the sense that the intervention was designed to reduce smoking, these participants could be considered the intervention's successes. However, by consulting the top-right cell, you can see that five non-smokers actually took up smoking following the intervention! Clearly, this is not the effect you were looking for, and it is important that you note this in your report. So, although overall there were more 'positive' changes than 'negative' changes, it can be enlightening to know the different 'directions of travel' that the participants took.
Test Statistics Table
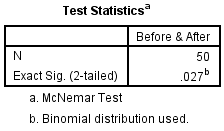
Now that we know that the proportion of non-smokers increased following the intervention, we would like to know whether this difference is statistically significant. To know this, we can use the result of McNemar's test, which can be found in the Test Statistics table below:
Published with written permission from SPSS Statistics, IBM Corporation.
If the statistical significance level (i.e., p-value) is less than .05 (i.e., p < .05), you have a statistically significant result and the proportion of non-smokers before and after the intervention is statistically significantly different. Alternatively, if p > .05, you do not have a statistically significant result and the proportion of non-smokers before and after the intervention is not statistically significantly different (i.e., the proportion of non-smokers does not change over the course of the intervention). In our example, p = .027 (using the exact p-value), which means that the proportion of non-smokers is statistically significantly different after the intervention as compared to before. Put another way, the change in the proportion of non-smokers following the intervention was statistically significant.
Note: You will notice that we reported the exact p-value of p = .027 (i.e., Exact Sig. (2-tailed)). When you carry out your own analysis, you may not have this exact p-value, but an asymptotic p-value instead (i.e., Asymp. Sig.). This is because SPSS Statistics calculates the p-value differently depending on the number of discordant pairs in your Crosstabulation table (i.e., the first table of output we showed you above). To understand the differences between these two types of p-value, and how to interpret and report them for your results, see our enhanced McNemar's test guide. You can access this enhanced guide and all of our content by subscribing to Laerd Statistics.
SPSS Statistics
Reporting the results from McNemar's test
Based on the results above, we could report the results of the study as follows:
Fifty participants were recruited to take part in an intervention designed to warn about the dangers of smoking. An exact McNemar's test determined that there was a statistically significant difference in the proportion of non-smokers pre- and post-intervention, p = .027.
Note: If your results used the asymptotic p-value rather than the exact p-value, we would suggest reporting this differently to take into account the differences between the two values.
In our enhanced McNemar's test guide, we show you how to incorporate the descriptive information from the Crosstabulation table (i.e., the Before & After table) into your write-up, as well as how to distinguish between asymptotic and exact p-values. We also show you how to write up the results using the Harvard and APA styles. You can learn more about McNemar's test, how to accurately set up your data in SPSS Statistics, and how to interpret and write up your findings in more detail in our enhanced McNemar's test guide, which you can access by subscribing to Laerd Statistics.