One-way MANOVA using Minitab
Introduction
The one-way multivariate analysis of variance (one-way MANOVA) is used to determine whether there are any differences between two or more groups of an independent variable on more than one continuous dependent variable. It can be considered an extension of the one-way ANOVA when you have multiple dependent variables.
For example, you could use a one-way MANOVA to determine whether students' short-term and long-term recall of facts differed based on three different lengths of lecture (i.e., the two dependent variables are "short-term memory recall" and "long-term memory recall", whilst the independent variable is "lecture duration", which has four independent groups: "30 minutes", "60 minutes", "90 minutes" and "120 minutes"). Alternately, a one-way MANOVA could be used to determine whether there is a difference in salary and bonuses based on degree type (i.e., the two dependent variables are "salary" and "bonuses", whilst the independent variable is "degree type", which has five groups: "business studies", "psychology", "biological sciences", "engineering" and "law").
When there is a statistically significant difference between the groups of the independent variable, it is possible to determine which specific groups were significantly different from each other using post hoc tests. You need to conduct these post hoc tests because the one-way MANOVA is an omnibus test statistic and cannot tell you which specific groups were significantly different from each other; it only tells you that at least two groups were different.
In this guide, we show you how to carry out a one-way MANOVA using Minitab, as well as interpret and report the results from this test. However, before we introduce you to this procedure, you need to understand the different assumptions that your data must meet in order for a one-way MANOVA to give you a valid result. We discuss these assumptions next.
Minitab
Assumptions
The one-way MANOVA has nine assumptions. You cannot test the first three of these assumptions with Minitab because they relate to your study design and choice of variables. However, you should check whether your study meets these three assumptions before moving on. If these assumptions are not met, there is likely to be a different statistical test that you can use instead. Assumption #4 is something that you can choose to test before your study, but is rarely checked. Assumptions #1, #2, #3 and #4 are explained below:
- Assumption #1: Your two or more dependent variables should be measured at a continuous level (i.e., they are interval or ratio variables). Examples of continuous variables include height (measured in feet and inches), temperature (measured in °C), salary (measured in US dollars), revision time (measured in hours), intelligence (measured using IQ score), firm size (measured in terms of the number of employees), age (measured in years), reaction time (measured in milliseconds), grip strength (measured in kg), power output (measured in watts), test performance (measured from 0 to 100), sales (measured in number of transactions per month), academic achievement (measured in terms of GMAT score), and so forth. If you are unsure whether your dependent variable is continuous (i.e., measured at the interval or ratio level), see our Types of Variable guide.
- Assumption #2: Your independent variable should consist of two or more categorical, independent (unrelated) groups. Examples of such independent variables include gender (two groups: male or female), treatment type (two groups: medication or no medication), educational level (three groups: high school, undergraduate or postgraduate), health insurance (two groups: yes or no), intensity of religious practice (two groups: practicing or non-practicing), personality type (two groups: introversion or extroversion), and so forth.
- Assumption #3:You should have independence of observations, which means that there is no relationship between the observations in each group or between the groups themselves. For example, there must be different participants in each group with no participant being in more than one group. If you do not have independence of observations, it is likely you have "related groups", which means you will need to use a one-way repeated measures MANOVA instead of the one-way MANOVA.
- Assumption #4: You should have an adequate sample size. Although the larger your sample size, the better, when carrying out a MANOVA, you at least need to have more cases (e.g., participants) in each group of the independent variable than the number of dependent variables you are analysing.
Assumptions #5, #6, #7, #8 and #9 relate to the nature of your data and all but #8 can be checked using Minitab. You have to check that your data meets these assumptions because if it does not, the results you get when running a one-way MANOVA might not be valid. In fact, do not be surprised if your data violates one or more of these assumptions. This is not uncommon. However, there are possible solutions to correct such violations (e.g., transforming your data) such that you can still use a one-way MANOVA. Assumptions #5, #6, #7, #8 and #9 are explained below:
- Assumption #5: There are no univariate or multivariate outliers. First, there can be no (univariate) outliers in each group of the independent variable for any of the dependent variables. This is a similar assumption to the one-way ANOVA, but for each dependent variable that you have in your MANOVA analysis. Univariate outliers are often just called outliers and are the same type of outliers you will have come across if you have conducted t-tests or ANOVAs. We refer to them as univariate in this guide to distinguish them from multivariate outliers. Multivariate outliers are cases which have an unusual combination of scores on the dependent variables.
- Assumption #6: There is multivariate normality. Unfortunately, multivariate normality is a particularly tricky assumption to test for and cannot be directly tested in Minitab. Instead, normality of each of the dependent variables for each of the groups of the independent variable is often used in its place as a best 'guess' as to whether there is multivariate normality. You can test for this using the Shapiro-Wilk test for normality, which is easily tested for using Minitab.
- Assumption #7: There is a linear relationship between each pair of dependent variables for each group of the independent variable. If the variables are not linearly related, the power of the test is reduced. You can test for this assumption by plotting a scatterplot matrix for each group of the independent variable.
- Assumption #8: There is a homogeneity of variance-covariance matrices. You can test this assumption using Box's M test of equality of covariance, but this is not available in Minitab.
- Assumption #9: There is no multicollinearity. Ideally, you want your dependent variables to be moderately correlated with each other. If the correlations are low, you might be better off running separate one-way ANOVAs, and if the correlation(s) are too high (greater than 0.9), you could have multicollinearity. This is problematic for MANOVA and needs to be screened out.
In practice, checking for assumptions #5, #6, #7, #8 and #9 will probably take up most of your time when carrying out a one-way MANOVA. However, it is not a difficult task and Minitab provides many of the tools you need to do this.
In the section, Test Procedure in Minitab, we illustrate the Minitab procedure required to perform a one-way MANOVA assuming that no assumptions have been violated. First, we set out the example we use to explain the one-way MANOVA procedure in Minitab.
Minitab
Example
A researcher wants to test the effectiveness of different types of learning intervention on exam performance. Exam performance was assessed as the scores achieved in a humanities exam and a science exam. These two example scores are the two dependent variables the researcher wants to measure. The different types of learning intervention were the current learning method (called the "Regular" programme), a rote learning programme (called the "Rote" programme) and a learning programme based on reasoning skills (called the "Reasoning" programme). These three types of learning intervention are the three categories of the independent variable.
To carry out this experiment, 30 students were recruited to take part in the study. Of these 30 students, 10 students were assigned to each learning method (i.e., 10 students to the "Regular" programme, 10 students to the "Rote" programme and 10 students to the "Reasoning" programme). A one-way MANOVA was used to assess the effect of these different learning interventions on student performance in the humanities and science exams.
Minitab
Setup in Minitab
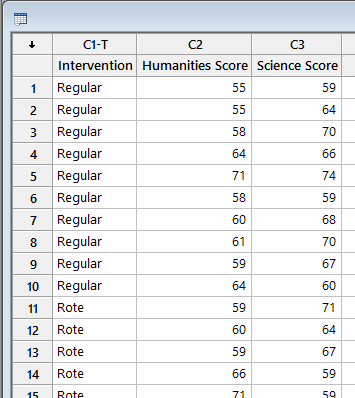
In Minitab, we set up the three variables. Under column ![]() we entered the name of the independent variable, Intervention, as follows:
we entered the name of the independent variable, Intervention, as follows: ![]() . Then, under column
. Then, under column ![]() we entered the name of the first dependent variable, Humanities Score, as follows:
we entered the name of the first dependent variable, Humanities Score, as follows: ![]() . Then, under column
. Then, under column ![]() we entered the name of the second dependent variable, Science Score, as follows:
we entered the name of the second dependent variable, Science Score, as follows: ![]() . The set up is as follows:
. The set up is as follows:
Published with written permission from Minitab Inc.
Minitab
Test Procedure in Minitab
In this section, we show you how to analyse your data using a one-way MANOVA in Minitab when the nine assumptions in the previous section, Assumptions, have not been violated. Therefore, the four steps required to run a one-way MANOVA in Minitab are shown below:
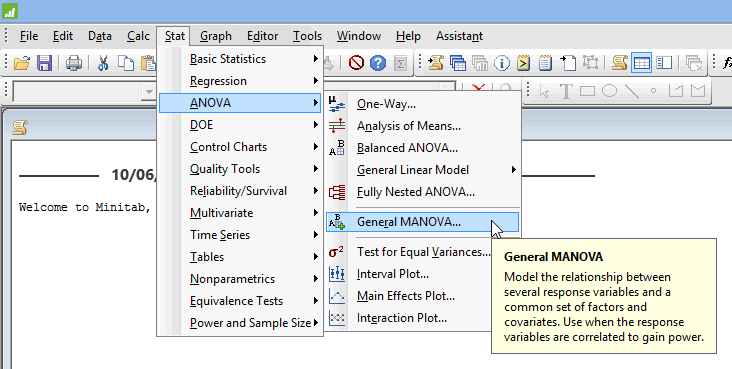
- Click Stat > ANOVA > General MANOVA... on the top menu, as shown below:

Published with written permission from Minitab Inc.
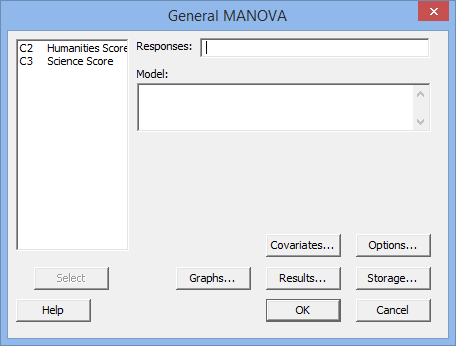
You will be presented with the following General MANOVA dialogue box:

Published with written permission from Minitab Inc.
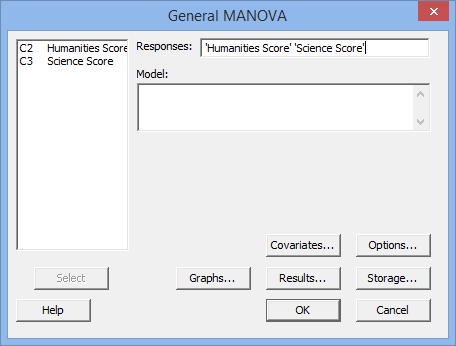
- Transfer the dependent variables, Humanities Score and Science Score, into the Responses: box. You will end up with a screen similar to that below:

Published with written permission from Minitab Inc.
Note: To transfer your variables, you first need to click into the Responses: box for your two variables to appear in the main left-hand box (e.g., C2 Humanities Score and C3 Science Score). This will activate the
 button (it is usually faded:
  ). To transfer the dependent variables, Humanities Score and Science Score, into the Responses: box, you can now either select C2 Humanities Score and C3 Science Score in the main left-hand box and press the
  button or simply double-click on C2 Humanities Score and then C3 Science Score.
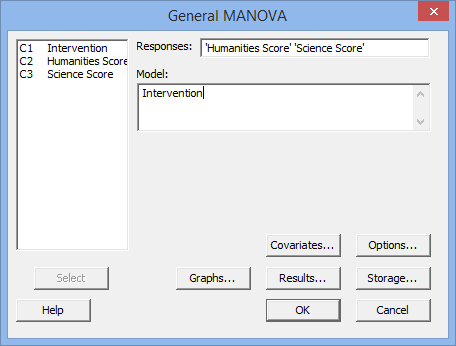
 - Transfer the independent variable, C1 Intervention, into the Model: box. You will end up with the screen as shown below:

Published with written permission from Minitab Inc.
Note: To transfer the independent variable, you first need to click into the Model: box for your independent variable to appear in the main left-hand box (i.e., C1 Intervention) (N.B., you will notice that there may be other variables in this main left-hand box in addition to your independent variable, but you can just ignore these). You can now either select the variables you want to transfer (e.g., C1 Intervention) in the main left-hand box into the Model: box by double-clicking on them or using the
 button, as you did in Step 2 above.
 - Click on the
 button. The output that Minitab produces is shown below.
Minitab
Output of the one-way MANOVA in Minitab
The Minitab output for the one-way MANOVA is shown below:
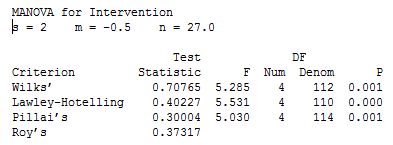
There are three rows you can interpret to get the result of the one-way MANOVA. These are the Wilks', Lawley-Hotelling and Pillai's rows. We will use the results of the Wilks' row. This reports Wilks' Lambda (Λ) and its statistical significance. Wilks' Lambda statistic is found under the Test Statistics column. You can see that Wilks' Lambda is 0.708 (to 3 d.p.). The statistical significance level (i.e., p-value) is found under the P column. You can see that it is .001 (i.e., p = .001). As such, the one-way MANOVA is statistically significant (because p < .05). In other words, there is a statistically significant difference between teaching interventions on exam performance.
Note: We present the output from the one-way MANOVA above. However, since you should have tested your data for the assumptions we explained earlier in the Assumptions section, you will also need to interpret the Minitab output that was produced when you tested for them. Also, remember that if your data failed any of these assumptions, the output that you get from the one-way MANOVA procedure (i.e., the output we discuss above) might no longer be valid and you will need to interpret the alternative Minitab output that is produced when they fail.
Minitab
Reporting the output of the one-way MANOVA
When you report the output of your one-way MANOVA, it is good practice to include:
- A. An introduction to the analysis you carried out.
- B. Information about your sample (N), including how many participants were in each of the groups of your independent variable (N.B., this is particularly useful if the group sizes were unequal or there were missing values).
- C. A statement of whether there was a statistically significant difference between the groups of your independent variable on the dependent variable. This will include Wilks' Lambda (Test Statistics), the F-statistic (F), numerator degrees of freedom (Num), denominator degrees of freedom (Denom), and significance level, or more specifically, the 2-tailed p-value (P).
Based on the Minitab output above, we could report the results of this study as follows:
- General
There was a statistically significant difference in academic performance based on the teaching method applied, F (4, 112) = 5.285, p = .001; Wilk's Λ = 0.708.
In addition to reporting the results as above, a diagram can be used to visually present your results. Furthermore, you are increasingly expected to report an "effect size" in addition to your one-way MANOVA results. Effect sizes are important because whilst the one-way MANOVA tells you whether the difference between group means is "real" (i.e., different in the population), it does not tell you the "size" of the difference. Whilst Minitab will not produce these effect sizes for you using this procedure, they can be calculated from the results Minitab produces.
