Spearman's Rank-Order Correlation
This guide will tell you when you should use Spearman's rank-order correlation to analyse your data, what assumptions you have to satisfy, how to calculate it, and how to report it. If you want to know how to run a Spearman correlation in SPSS Statistics, go to our Spearman's correlation in SPSS Statistics guide.
When should you use the Spearman's rank-order correlation?
The Spearman's rank-order correlation is the nonparametric version of the Pearson product-moment correlation. Spearman's correlation coefficient, (ρ, also signified by rs) measures the strength and direction of association between two ranked variables.
What are the assumptions of the test?
You need two variables that are either ordinal, interval or ratio (see our Types of Variable guide if you need clarification). Although you would normally hope to use a Pearson product-moment correlation on interval or ratio data, the Spearman correlation can be used when the assumptions of the Pearson correlation are markedly violated. However, Spearman's correlation determines the strength and direction of the monotonic relationship between your two variables rather than the strength and direction of the linear relationship between your two variables, which is what Pearson's correlation determines.
What is a monotonic relationship?
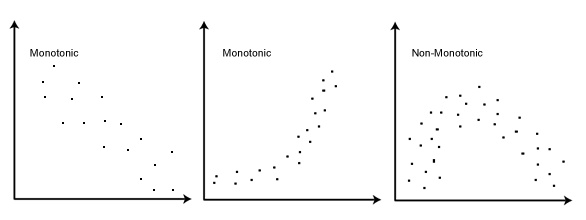
A monotonic relationship is a relationship that does one of the following: (1) as the value of one variable increases, so does the value of the other variable; or (2) as the value of one variable increases, the other variable value decreases. Examples of monotonic and non-monotonic relationships are presented in the diagram below:
Why is a monotonic relationship important to Spearman's correlation?
Spearman's correlation measures the strength and direction of monotonic association between two variables. Monotonicity is "less restrictive" than that of a linear relationship. For example, the middle image above shows a relationship that is monotonic, but not linear.
A monotonic relationship is not strictly an assumption of Spearman's correlation. That is, you can run a Spearman's correlation on a non-monotonic relationship to determine if there is a monotonic component to the association. However, you would normally pick a measure of association, such as Spearman's correlation, that fits the pattern of the observed data. That is, if a scatterplot shows that the relationship between your two variables looks monotonic you would run a Spearman's correlation because this will then measure the strength and direction of this monotonic relationship. On the other hand if, for example, the relationship appears linear (assessed via scatterplot) you would run a Pearson's correlation because this will measure the strength and direction of any linear relationship. You will not always be able to visually check whether you have a monotonic relationship, so in this case, you might run a Spearman's correlation anyway.
How to rank data?
In some cases your data might already be ranked, but often you will find that you need to rank the data yourself (or use SPSS Statistics to do it for you). Thankfully, ranking data is not a difficult task and is easily achieved by working through your data in a table. Let us consider the following example data regarding the marks achieved in a maths and English exam:
| | Marks |
|---|
| English |
56 |
75 |
45 |
71 |
61 |
64 |
58 |
80 |
76 |
61 |
| Maths |
66 |
70 |
40 |
60 |
65 |
56 |
59 |
77 |
67 |
63 |
The procedure for ranking these scores is as follows:
First, create a table with four columns and label them as below:
| English (mark) | Maths (mark) | Rank (English) | Rank (maths) |
| 56 | 66 | 9 | 4 |
| 75 | 70 | 3 | 2 |
| 45 | 40 | 10 | 10 |
| 71 | 60 | 4 | 7 |
| 61 | 65 | 6.5 | 5 |
| 64 | 56 | 5 | 9 |
| 58 | 59 | 8 | 8 |
| 80 | 77 | 1 | 1 |
| 76 | 67 | 2 | 3 |
| 61 | 63 | 6.5 | 6 |
You need to rank the scores for maths and English separately. The score with the highest value should be labelled "1" and the lowest score should be labelled "10" (if your data set has more than 10 cases then the lowest score will be how many cases you have). Look carefully at the two individuals that scored 61 in the English exam (highlighted in bold). Notice their joint rank of 6.5. This is because when you have two identical values in the data (called a "tie"), you need to take the average of the ranks that they would have otherwise occupied. We do this because, in this example, we have no way of knowing which score should be put in rank 6 and which score should be ranked 7. Therefore, you will notice that the ranks of 6 and 7 do not exist for English. These two ranks have been averaged ((6 + 7)/2 = 6.5) and assigned to each of these "tied" scores.
What is the definition of Spearman's rank-order correlation?
There are two methods to calculate Spearman's correlation depending on whether: (1) your data does not have tied ranks or (2) your data has tied ranks. The formula for when there are no tied ranks is:
where di = difference in paired ranks and n = number of cases. The formula to use when there are tied ranks is:
where i = paired score.


