Spearman's Rank-Order Correlation using SPSS Statistics
Introduction
The Spearman rank-order correlation coefficient (Spearman’s correlation, for short) is a nonparametric measure of the strength and direction of association that exists between two variables measured on at least an ordinal scale. It is denoted by the symbol rs (or the Greek letter ρ, pronounced rho). The test is used for either ordinal variables or for continuous data that has failed the assumptions necessary for conducting the Pearson's product-moment correlation.
For example, you could use a Spearman’s correlation to understand whether there is an association between exam performance and time spent revising; whether there is an association between depression and length of unemployment; and so forth. If you would like some more background information about this test, which does not include instructions for SPSS Statistics, see our more general statistical guide: Spearman's rank-order correlation. Possible alternative tests to Spearman's correlation are Kendall's tau-b or Goodman and Kruskal's gamma.
This "quick start" guide shows you how to carry out a Spearman’s correlation using SPSS Statistics. We show you the main procedure to carry out a Spearman’s correlation in SPSS Statistics procedure section. First, we introduce you to the assumptions that you must consider when carrying out a Spearman’s correlation.
SPSS Statistics
Assumptions of Spearman's correlation
When you choose to analyse your data using Spearman’s correlation, part of the process involves checking to make sure that the data you want to analyse can actually be analysed using a Spearman’s correlation. You need to do this because it is only appropriate to use a Spearman’s correlation if your data "passes" three assumptions that are required for Spearman’s correlation to give you a valid result. In practice, checking for these three assumptions just adds a little bit more time to your analysis, requiring you to click of few more buttons in SPSS Statistics when performing your analysis, as well as think a little bit more about your data, but it is not a difficult task. These three assumptions are:
- Assumption #1: Your two variables should be measured on an ordinal, interval or ratio scale. Examples of ordinal variables include Likert scales (e.g., a 7-point scale from "strongly agree" through to "strongly disagree"), amongst other ways of ranking categories (e.g., a 3-pont scale explaining how much a customer liked a product, ranging from "Not very much", to "It is OK", to "Yes, a lot"). Examples of interval/ratio variables include revision time (measured in hours), intelligence (measured using IQ score), exam performance (measured from 0 to 100), weight (measured in kg), and so forth. You can learn more about ordinal, interval and ratio variables in our article: Types of Variable.
- Assumption #2: Your two variables represent paired observations. For example, imagine that you were interested in the relationship between daily cigarette consumption and amount of exercise performed each week. A single paired observation reflects the score on each variable for a single participant (e.g., the daily cigarette consumption of "Participant 1" and the amount of exercise performed each week by "Participant 1"). With 30 participants in the study, this means that there would be 30 paired observations.
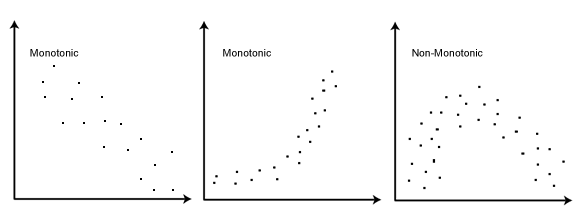
- Assumption #3: There is a monotonic relationship between the two variables. A monotonic relationship exists when either the variables increase in value together, or as one variable value increases, the other variable value decreases. Whilst there are a number of ways to check whether a monotonic relationship exists between your two variables, we suggest creating a scatterplot using SPSS Statistics, where you can plot one variable against the other, and then visually inspect the scatterplot to check for monotonicity. Your scatterplot may look something like one of the following:

The relationship displayed in your scatterplot should be monotonic. In our enhanced guides, we show you how to: (a) create a scatterplot to check for a monotonic relationship when carrying out Spearman’s correlation using SPSS Statistics; (b) interpret different scatterplot results; and (c) consider possible solutions if your data fails this assumption. Just remember that if you do not test these assumptions correctly, the results you get when running a Spearman's correlation might not be valid. This is why we dedicate a number of sections of our enhanced Spearman's correlation guide to help you get this right. You can find out about our enhanced content as a whole on our Features: Overview page, or more specifically, learn how we help with testing assumptions on our Features: Assumptions page.Note: Spearman's correlation determines the degree to which a relationship is monotonic. Put another way, it determines whether there is a monotonic component of association between two continuous or ordinal variables. As such, monotonicity is not actually an assumption of Spearman's correlation. However, you would not normally want to pursue a Spearman's correlation to determine the strength and direction of a monotonic relationship when you already know the relationship between your two variables is not monotonic. Instead, the relationship between your two variables might be better described by another statistical measure of association. For this reason, it is not uncommon to view the relationship between your two variables in a scatterplot to see if running a Spearman's correlation is the best choice as a measure of association or whether another measure would be better.
In terms of assumption #3 above, you can check this using SPSS Statistics. If your two variables do not appear to have a monotonic relationship, you might consider using a different statistical test, which we show you how to do in our Statistical Test Selector (N.B., this is part of our enhanced content).
It is also worth noting that a Spearman’s correlation can be used when your two variables are not normally distributed. It is also not very sensitive to outliers, which are observations within your data that do not follow the usual pattern. Since Spearman’s correlation is not very sensitive to outliers, this means that you can still obtain a valid result from using this test when you have outliers in your data.
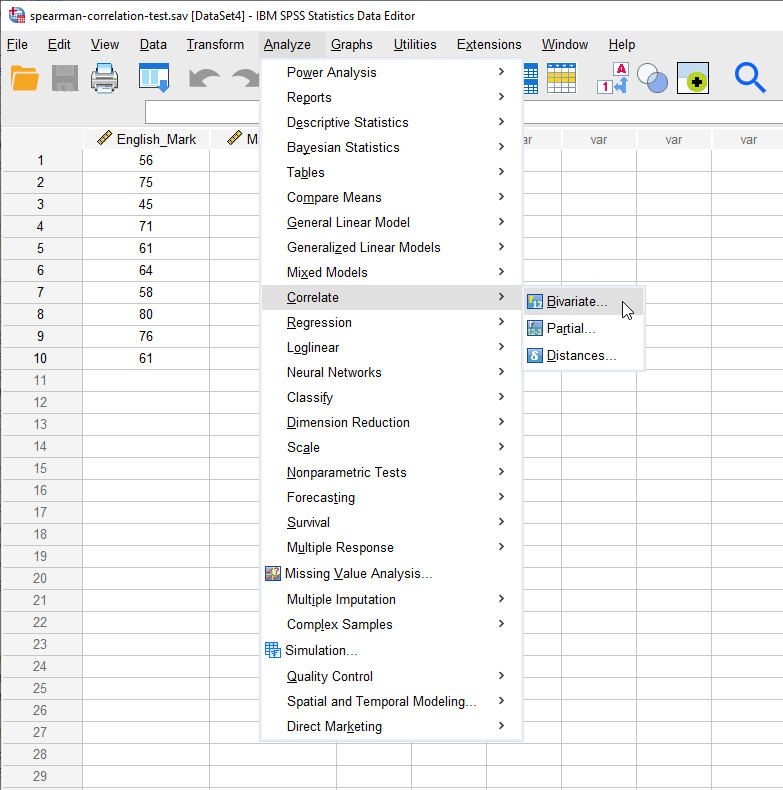
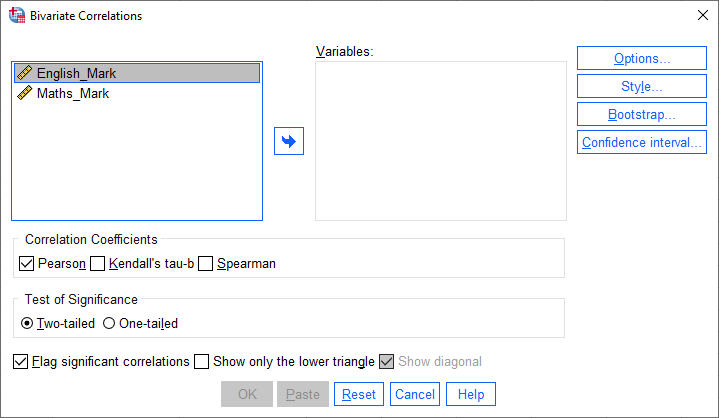
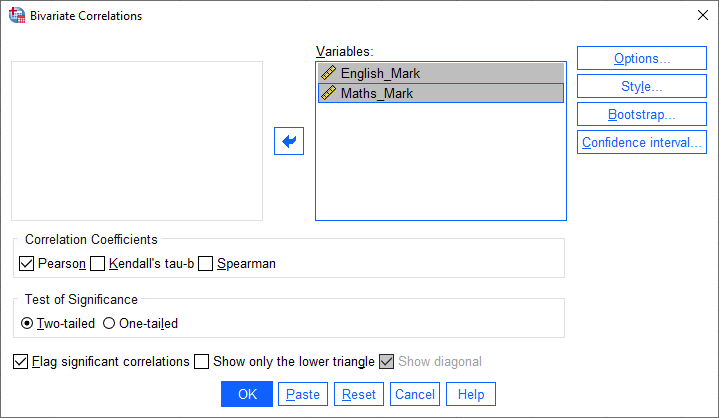
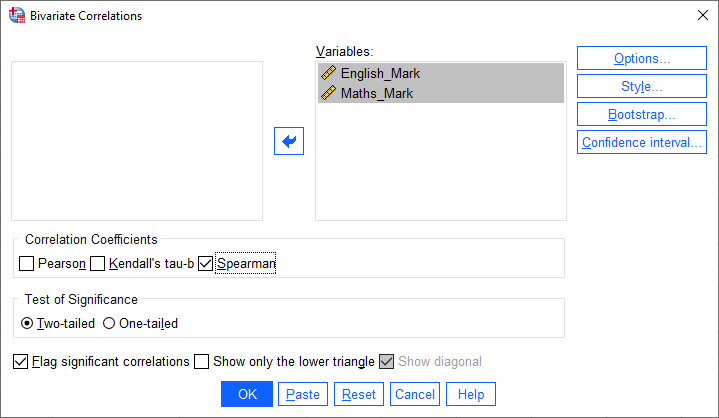
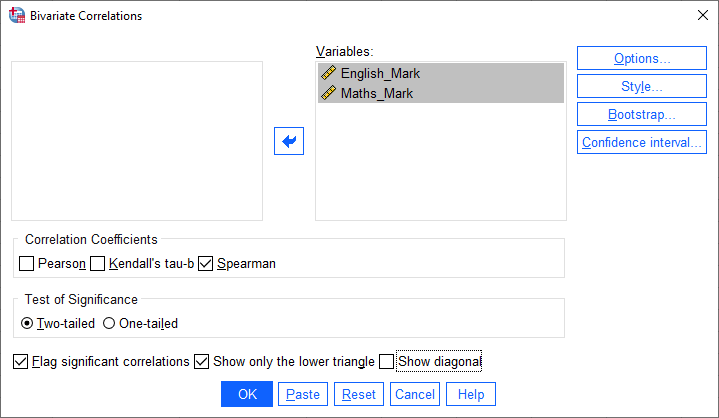
In the section, SPSS Statistics procedure, we set out the SPSS Statistics procedure to perform a Spearman’s correlation assuming that no assumptions have been violated. First, we set out the example we use to explain the Spearman’s correlation procedure in SPSS Statistics.