SPSS
Assumption #4:
Evaluating the distributions of the two groups of your independent variable
The Mann-Whitney U test was developed as a test of stochastic equality (Mann and Whitney, 1947). However, it is not often that the test is directly interpreted in this way. In practice, the Mann-Whitney U test is more broadly used to interpret whether there are differences in the "distributions" of two groups or differences in the "medians" of two groups. However, this is not so much a choice that you make, but is based on whether the distribution of scores for both groups of your independent variable (e.g., the distribution of scores for "males" and the distribution of scores for "females" for the independent variable, "gender") have the same shape or a different shape.
If the two distributions have a different shape, the Mann-Whitney U test is used to determine whether there are differences in the distributions of your two groups. However, if the two distributions are the same shape, the Mann-Whitney U test is used to determine whether there are differences in the medians of your two groups. We discuss these two different approaches to using the Mann-Whitney U test in turn:
SPSS
A test of equal distributions
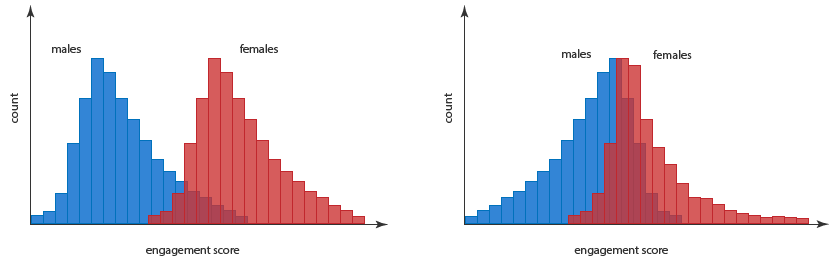
Let us consider the first possible objective for using the Mann-Whitney U test – testing for differences in distributions – by considering an example where engagement score was measured in males and females. Using this interpretation of the Mann-Whitney U test, we would wish to know whether male and female engagement scores are similar or whether one gender has higher or lower values than the other. An example of similar engagement scores and dissimilar engagement scores can be seen in the diagrams shown below:

For the above diagrams, you would most likely want to confirm that males and females had similar scores in the diagram on the left, but that females had higher engagement scores than males in the diagram on the right. The Mann-Whitney U test can do this – determine whether the values in one group are lower or higher than the values in the other group (e.g., females higher than males) – by comparing the mean ranks of each distribution of scores (e.g., males and females engagement scores).
The Mann-Whitney U test works by ranking each score of the dependent variable (e.g., engagement), irrespective of the group it is in (e.g., males or females), according to its size, with the smallest rank assigned to the smallest value. The ranks obtained for males are then averaged, as are the female's ranks. This results in a mean rank for males and a mean rank for females. If the distributions are identical, which is the null hypothesis of the Mann-Whitney U test, the mean rank will be the same for both males and females. However, if one group (e.g., females) tends to have higher values than the other group, that group's scores will have been assigned higher ranks and will have a higher mean rank (and vice-versa for the group with lower scores). It is this difference in mean rank that is tested by the Mann-Whitney U test for statistical significance. Using this approach, different distributions of scores can be accommodated by the Mann-Whitney U test when determining whether values (i.e., via mean ranks) are different between two groups, as shown below:
Both charts above show non-identical distributions, but with females having higher engagement scores than males in both cases. The chart on the left shows the distribution of male and female engagement scores having the same shape, but a different location (i.e., the female scores are 'shifted' to the right). However, the chart on the right shows dissimilarly shaped distributions of male and female engagement scores, but again with females tending to score higher than males for engagement. The mean rank of both of these distributions can be calculated and assessed by the Mann-Whitney U test to determine whether one group has higher or lower scores than the other group.
Sometimes you will be required to explicitly state the null and alternative hypotheses for a Mann-Whitney U test, and then state which was accepted and rejected at the end of the experiment. One such null hypothesis might be:
H0: the distribution of scores for the two groups are equal
And the alternative hypothesis might be:
HA: the distribution of scores for the two groups are not equal
However, another way to express the alternative hypothesis is as follows:
HA: the mean ranks of the two groups are not equal
The reason for describing the alternative hypothesis with respect to mean ranks is due to a problem that can occur if you have groups with different variances. Under these conditions, you can have very different distributions but still not reject the null hypothesis of equal distributions (see, for example, Hart (2001)) or get a good idea of whether values are higher or lower in one group compared to another. Indeed, any interpretation of differences between groups becomes difficult when variances are not equal.
SPSS
A test of medians
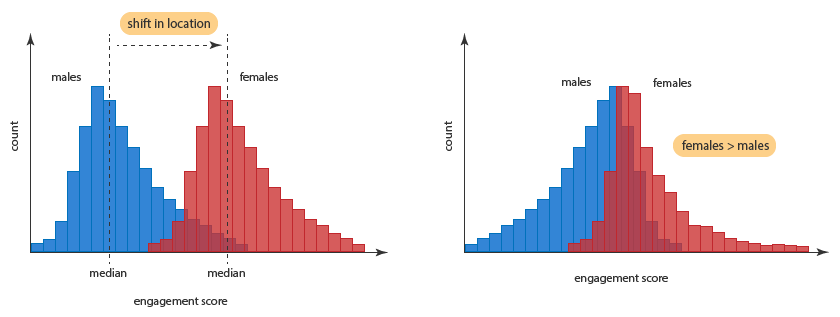
You read in the previous section that – regardless of similar or dissimilar distributions – you can use the Mann-Whitney U test to determine whether engagement scores are higher or lower in males versus females based on the use of mean ranks to describe the group differences. However, rather than mean ranks, it would be nice if we were able to describe our data using the more familiar median value. This would be more in keeping with the Mann-Whitney U test being used as an alternative to the independent-samples t-test (i.e., both would then use a measure of central tendency: the 'mean' for the independent-samples t-test and the 'median' for the Mann-Whitney U test). Indeed, the Mann-Whitney U test can be used for this very purpose, but it requires an additional assumption about the shapes of the distributions: to compare medians the distribution of engagement scores for males and females must have the same shape (including dispersion) (see below):
First, consider the chart on the right where the distributions are differently shaped. In this situation, you are limited to describing the differences between male and female engagement scores to higher/lower statements as described in the previous section. However, the chart on the left shows an example where the distributions of engagement scores for males and females are the same shape. As such, only the location of the engagement scores is considered to be different between the two groups, with the median being the measure of location used. This is sometimes referred to as a shift in location (i.e., all scores are being shifted to the right). What all this means is that we can use the Mann-Whitney U test to determine if the group's medians are statistically significantly different rather than before where we could only make more general higher/lower statements based on mean ranks.
Expressing the difference in the medians as a null and alternative hypothesis, we have:
H0: the distributions of the two groups are equal
HA: the medians of the two groups are not equal
It is important to note that the null hypothesis is the same for both detecting equal distributions or changes in median using the Mann-Whitney U test; namely, that the distributions of the two groups are equal. It is just that with the assumption of similarly shaped distributions, you can appropriate any differences between groups highlighted by the Mann-Whitney U test as being down to a difference in medians.