One-way ANOVA in SPSS Statistics (cont...)
SPSS Statistics Output of the one-way ANOVA
SPSS Statistics generates quite a few tables in its one-way ANOVA analysis. In this section, we show you only the main tables required to understand your results from the one-way ANOVA and Tukey post hoc test. For a complete explanation of the output you have to interpret when checking your data for the six assumptions required to carry out a one-way ANOVA, see our Features: One-way ANOVA page. This includes relevant boxplots, and output from the Shapiro-Wilk test for normality and test for homogeneity of variances. Also, if your data failed the assumption of homogeneity of variances, we take you through the results for Welch ANOVA, which you will have to interpret rather than the standard one-way ANOVA in this guide. Below, we focus on the descriptives table, as well as the results for the one-way ANOVA and Tukey post hoc test only. We will go through each table in turn.
SPSS Statistics
Descriptives Table
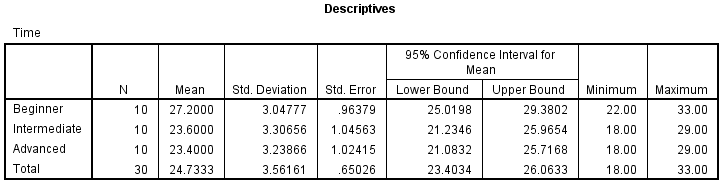
The descriptives table (see below) provides some very useful descriptive statistics, including the mean, standard deviation and 95% confidence intervals for the dependent variable (Time) for each separate group (Beginners, Intermediate and Advanced), as well as when all groups are combined (Total). These figures are useful when you need to describe your data.

Published with written permission from SPSS Statistics, IBM Corporation.
SPSS Statistics
ANOVA Table
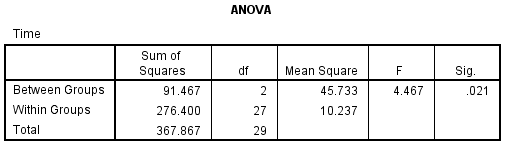
This is the table that shows the output of the ANOVA analysis and whether there is a statistically significant difference between our group means. We can see that the significance value is 0.021 (i.e., p = .021), which is below 0.05. and, therefore, there is a statistically significant difference in the mean length of time to complete the spreadsheet problem between the different courses taken. This is great to know, but we do not know which of the specific groups differed. Luckily, we can find this out in the Multiple Comparisons table which contains the results of the Tukey post hoc test.
Published with written permission from SPSS Statistics, IBM Corporation.
SPSS Statistics
Multiple Comparisons Table
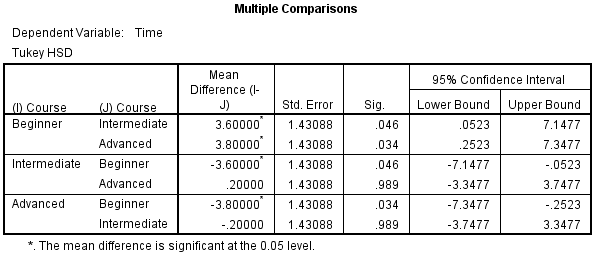
From the results so far, we know that there are statistically significant differences between the groups as a whole. The table below, Multiple Comparisons, shows which groups differed from each other. The Tukey post hoc test is generally the preferred test for conducting post hoc tests on a one-way ANOVA, but there are many others. We can see from the table below that there is a statistically significant difference in time to complete the problem between the group that took the beginner course and the intermediate course (p = 0.046), as well as between the beginner course and advanced course (p = 0.034). However, there were no differences between the groups that took the intermediate and advanced course (p = 0.989).
Published with written permission from SPSS Statistics, IBM Corporation.
It is also possible to run comparisons between specific groups that you decided were of interest before you looked at your results. For example, you might have expressed an interest in knowing the difference in the completion time between the beginner and intermediate course groups. This type of comparison is often called a planned contrast or a simple custom contrast. However, you do not have to confine yourself to the comparison between two time points only. You might have had an interest in understanding the difference in completion time between the beginner course group and the average of the intermediate and advanced course groups. This is called a complex contrast. All these types of custom contrast are available in SPSS Statistics. In our enhanced guide we show you how to run custom contrasts in SPSS Statistics using syntax (or sometimes a combination of the graphical user interface and syntax) and how to interpret and report the results. In addition, we also show you how to "trick" SPSS Statistics into applying a Bonferroni adjustment for multiple comparisons which it would otherwise not do.
SPSS Statistics
Reporting the output of the one-way ANOVA
Based on the results above, you could report the results of the study as follows (N.B., this does not include the results from your assumptions tests or effect size calculations):
There was a statistically significant difference between groups as determined by one-way ANOVA (F(2,27) = 4.467, p = .021). A Tukey post hoc test revealed that the time to complete the problem was statistically significantly lower after taking the intermediate (23.6 ± 3.3 min, p = .046) and advanced (23.4 ± 3.2 min, p = .034) course compared to the beginners course (27.2 ± 3.0 min). There was no statistically significant difference between the intermediate and advanced groups (p = .989).
In our enhanced one-way ANOVA guide, we show you how to write up the results from your assumptions tests, one-way ANOVA and Tukey post hoc results if you need to report this in a dissertation, thesis, assignment or research report. We do this using the Harvard and APA styles (see our Features: One-way ANOVA page to learn more). It is also worth noting that in addition to reporting the results from your assumptions, one-way ANOVA and Tukey post hoc test, you are increasingly expected to report an effect size. Whilst there are many different ways you can do this, we show you how to calculate an effect size from your SPSS Statistics results in our enhanced one-way ANOVA guide. Effect sizes are important because whilst the one-way ANOVA tells you whether differences between group means are "real" (i.e., different in the population), it does not tell you the "size" of the difference. Providing an effect size in your results helps to overcome this limitation. You can learn more about our enhanced one-way ANOVA guide on our Features: One-way ANOVA page, or our enhanced content in general on our Features: Overview page.