SPSS Statistics
Interpreting the SPSS Statistics output from a Mann-Whitney U test
If you have been following this guide from page one, you will know that the following output and interpretation relates to the Mann-Whitney U test results when your two distributions have a different shape, such that you are comparing mean ranks rather than medians. This is what happens when your data has violated Assumption #4 of the Mann-Whitney U test. The output is also based on the use of the Legacy Dialogs > 2 Independent Samples procedure in SPSS Statistics. If you have used the Nonparametric Tests > Independent Samples procedure in SPSS Statistics or you need to know how to interpret medians because your data has met Assumption #4 of the Mann-Whitney U test, we explain how to do this in our enhanced Mann-Whitney U test guide, which you can access by subscribing to Laerd Statistics.
In the SPSS Statistics output below, we show you how to report the Mann-Whitney U test using mean ranks. To do this, SPSS Statistics produces three tables of output:
Descriptives
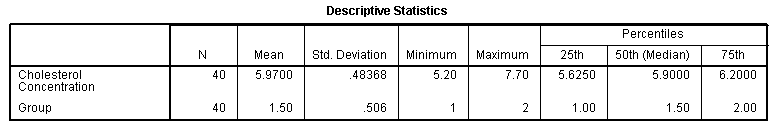
The Descriptive Statistics table looks as follows:

Published with written permission from SPSS Statistics, IBM Corporation.
Although we have decided to show you how you can get SPSS Statistics to provide descriptive statistics for the Mann-Whitney U test, they are not actually very useful. The reason for this is twofold. Firstly, in order to compare the groups, we need the individual group values, not the amalgamated ones. This table does not provide us with this vital information, so we cannot compare any possible differences between the exercise and diet groups. Secondly, we chose the Mann-Whitney U test because one of the individual groups (exercise group) was not normally distributed. However, we have not tested to see if the amalgamation of the two groups results in the larger group being normally distributed. Therefore, we do not know whether to use the mean and standard deviation or the median and interquartile range (IQR). The IQR is the 25th to 75th percentile. This will act as a surrogate to the standard deviation we would otherwise report if the data were normally distributed. For these reasons, we recommend that you ignore this table.
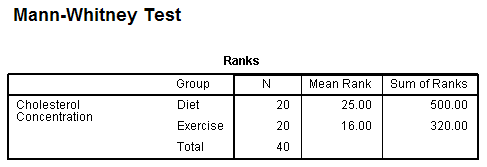
Ranks Table
The Ranks table is the first table that provides information regarding the output of the actual Mann-Whitney U test. It shows mean rank and sum of ranks for the two groups tested (i.e., the exercise and diet groups):
Published with written permission from SPSS Statistics, IBM Corporation.
The table above is very useful because it indicates which group can be considered as having the higher cholesterol concentrations, overall; namely, the group with the highest mean rank. In this case, the diet group had the highest cholesterol concentrations.
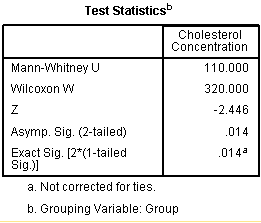
Test Statistics Table
This table shows us the actual significance value of the test. Specifically, the Test Statistics table provides the test statistic, U statistic, as well as the asymptotic significance (2-tailed) p-value.
Published with written permission from SPSS Statistics, IBM Corporation.
From this data, it can be concluded that cholesterol concentration in the diet group was statistically significantly higher than the exercise group (U = 110, p = .014). Depending on the size of your groups, SPSS Statistics will produce both exact and asymptotic statistical significance levels. Understanding which one to use is explained in our enhanced guide.
In our enhanced Mann-Whitney U test guide, we show you: (a) how to use SPSS Statistics to determine whether your two distributions have the same shape or a different shape; (b) the two procedures – Nonparametric Tests > Independent Samples and Legacy Dialogs > 2 Independent Samples – that you can use to carry out a Mann-Whitney U test; (c) how to use SPSS Statistics to generate medians for the Mann-Whitney U test if your two distributions have the same shape; and (d) how to fully write up the results of the Mann-Whitney U test procedure whether you are comparing mean ranks or medians. We do this using the Harvard and APA styles. You can access our enhanced Mann-Whitney U test guide, as well as all of our SPSS Statistics content, by subscribing to Laerd Statistics, or learn more about our enhanced content in general on our Features: Overview page.