Jonckheere-Terpstra test using SPSS Statistics
Introduction
The Jonckheere-Terpstra test is a rank-based nonparametric test that can be used to determine if there is a statistically significant trend between an ordinal independent variable and a continuous or ordinal dependent variable. The Jonckheere-Terpstra test tests for an ordered difference in medians where you need to state the direction of this order (this will become clearer below). It is also known as the Jonckheere-Terpstra test for ordered alternatives.
Note: The Jonckheere-Terpstra test is similar to the Kruskal-Wallis H test, which can be used to determine if there are statistically significant differences between two or more groups of an independent variable on a continuous or ordinal dependent variable. However, unlike the Jonckheere-Terpstra test, the Kruskal-Wallis H test does not predict how the differences in the scores of the dependent variable will depend on the ordinal nature of the groups of the independent variable. This is explained further in the Assumptions section later.
For example, you could use a Jonckheere-Terpstra test to understand whether test scores, measured on a continuous scale from 0-100, differed based on time spent revising (i.e., your dependent variable would be "test score" and your independent variable would be "revision time", which has four ordinal independent groups: "0-5 hours", "6-10 hours", "11-15 hours" and "16-20 hours"). You expect that median test score increases with increasing hours spent revising. Alternately, you could use the Jonckheere-Terpstra test to understand whether job satisfaction, measured on an ordinal scale, differed based on job position (i.e., your dependent variable would be "job satisfaction", measured on a 5-point scale from "very satisfied" to "very dissatisfied", and your independent variable would be "job position", which has three ordered independent groups: "Account Executive", "Account Manager" and "Account Director"). You expect job satisfaction to increase with higher job position.
This "quick start" guide shows you how to carry out a Jonckheere-Terpstra test using SPSS Statistics, as well as how to interpret and report the results from this test. However, before we introduce you to this procedure, you need to understand the different assumptions that your data must meet in order for a Jonckheere-Terpstra test to give you a valid result. We discuss these assumptions next.
SPSS Statistics
Basic requirements and assumptions of the Jonckheere-Terpstra test
When you choose to analyse your data using a Jonckheere-Terpstra test, part of the process involves checking to make sure that the data you want to analyse can actually be analysed using a Jonckheere-Terpstra test. You need to do this because it is only appropriate to use a Jonckheere-Terpstra test if your data "passes" six assumptions that are required for a Jonckheere-Terpstra test to give you a valid result. In practice, checking for these six assumptions just adds a little bit more time to your analysis, requiring you to click a few more buttons in SPSS Statistics when performing your analysis, as well as think a little bit more about your data, but it is not a difficult task.
Before we introduce you to these six assumptions, do not be surprised if, when analysing your own data using SPSS Statistics, one or more of these assumptions is violated (i.e., is not met). This is not uncommon when working with real-world data rather than textbook examples, which often only show you how to carry out a Jonckheere-Terpstra test when everything goes well! However, don’t worry. Even when your data fails certain assumptions, there is often a solution to overcome this. First, let’s take a look at these six assumptions:
- Assumption #1: Your dependent variable should be measured at the ordinal or continuous level (i.e., the interval or ratio level). Examples of ordinal variables include Likert scales (e.g., a 7-point scale from "strongly agree" through to "strongly disagree"), amongst other ways of ranking groups (e.g., a 3-point scale explaining how much a customer liked a product, ranging from "Not very much", to "It is OK", to "Yes, a lot"). Examples of continuous variables include revision time (measured in hours), intelligence (measured using IQ score), exam performance (measured from 0 to 100), weight (measured in kg), and so forth. You can learn more about ordinal and continuous variables in our article: Types of Variable.
- Assumption #2: Your independent variable should consist of two or more ordinal, independent groups. Typically, a Jonckheere-Terpstra test is used when you have three or more ordinal, independent groups, but it can be used for just two groups (i.e., a one-tailed Mann-Whitney U test is more commonly used for two groups). Example independent variables that meet this criterion include physical activity level (e.g., four groups: sedentary, low, moderate and high), body composition (e.g., three groups: normal weight, overweight and obese), and so forth.
- Assumption #3: You should have independence of observations, which means that there is no relationship between the observations in each group or between the groups themselves. For example, there must be different participants in each group with no participant being in more than one group. This is more of a study design issue than something you can test for, but it is an important assumption of the Jonckheere-Terpstra test. If your study fails this assumption, you will need to use another statistical test instead of the Jonckheere-Terpstra test (e.g., a Friedman test). If you are unsure whether your study meets this assumption, you can use our Statistical Test Selector, which is part of our enhanced content.
- Assumption #4: In order to know how to interpret the results from a Jonckheere-Terpstra test, you have to determine whether the distributions in each group (i.e., the distribution of scores for each group of the independent variable) have the same shape and the same variability. That is, the distributions of the scores must be the same with the only possible difference being a shift in location (i.e., scores can be higher or lower in some groups, but the distribution of the scores remains the same). This allows you to use the Jonckheere-Terpstra test as a test of medians.
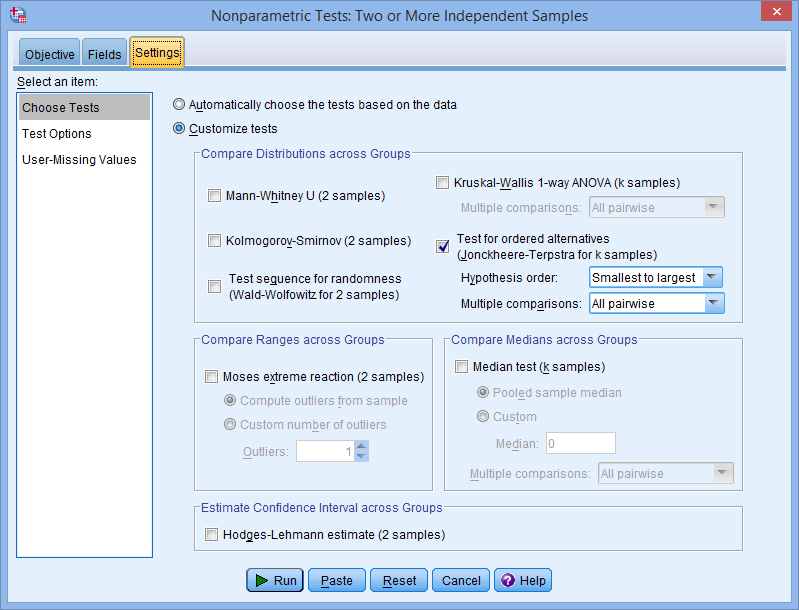
- Assumption #5: You need to predict, a priori, the order of the groups of the independent variable when running the Jonckheere-Terpstra test (i.e., the term, "a priori", simply means that you have to predict this order "before" you collect your data, typically when you set the research questions/hypotheses for your study). This will most likely be the ordered groups of the ordinal independent variable. Essentially, you cannot look at the data first and then order the groups based on the data. That is, you cannot rearrange the groups so that they have an order based on the order of the values discovered from the data.
- Assumption #6: You need to predict, "a priori", the direction of the alternative hypothesis. The term "a priori" simply means that you need to predict the direction of the alternative hypothesis without looking at your data (i.e., "before" looking at your data). This is to ensure that this is a "prediction" and not based on you having been able to evaluate the data first. When we refer to predicting the "direction of the alternative hypothesis", this means that you need to predict whether the medians increase or decrease as the groups of the ordinal variables increase or decrease. To illustrate this, take the example above where you could use the Jonckheere-Terpstra test to understand whether job satisfaction, measured on an ordinal scale, differed based on job position (i.e., your dependent variable would be "job satisfaction", measured on a 5-point scale from "very satisfied" to "very dissatisfied", and your independent variable would be "job position", which has three ordered independent groups: from the lowest position, "Account Executive", to "Account Manager" and then the highest position, "Account Director"). Now, let's imagine that the prediction we made before looking at the data was that "job satisfaction will increase with higher job position". We are making the prediction that higher median levels of job satisfaction (i.e., a trend from very dissatisfied to very satisfied) will increase with higher median levels of job position (i.e., a trend from Account Executive to Account Director).
You can check assumption #4 using SPSS Statistics. You should also check that you meet assumptions #1, #2, #3, #5 and #6, which you can do without using SPSS Statistics.
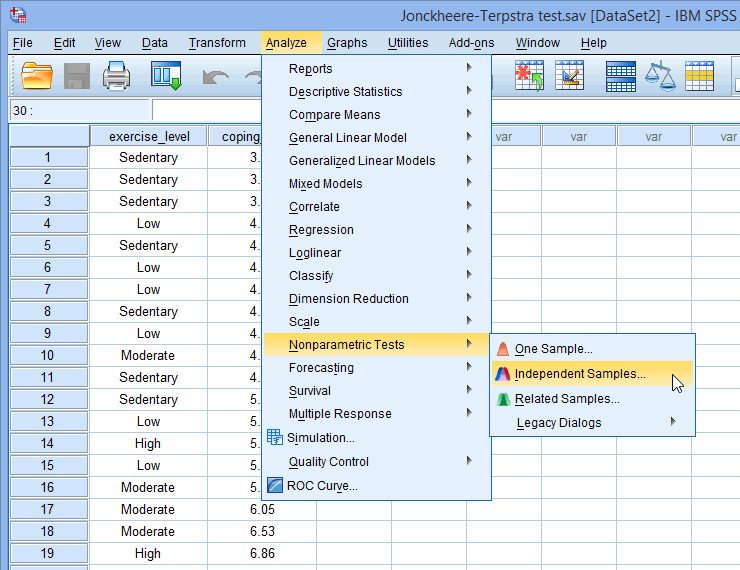
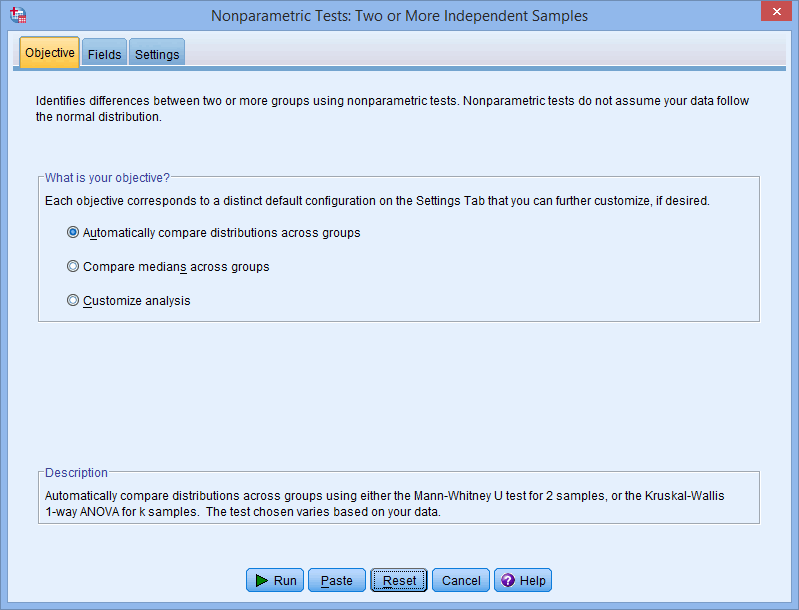
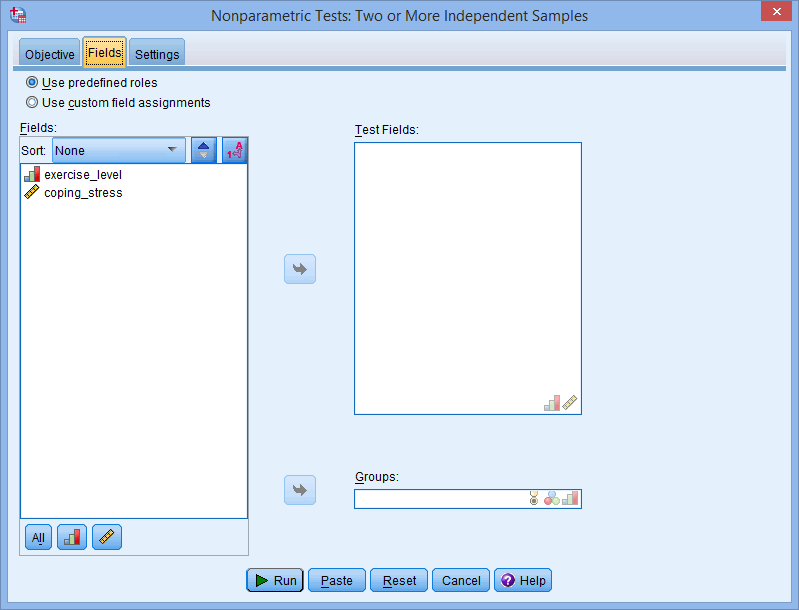
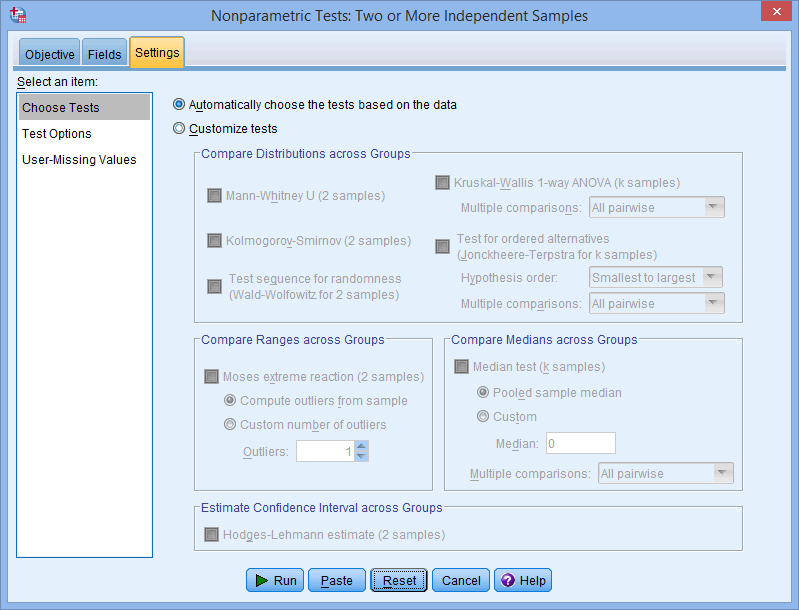
In the Test Procedure in SPSS Statistics section of this "quick start" guide, we illustrate the SPSS Statistics procedure to perform a Jonckheere-Terpstra test assuming that you have met all the assumptions. First, we set out the example we use to explain the Jonckheere-Terpstra test procedure in SPSS Statistics.
SPSS Statistics
Example used in this guide
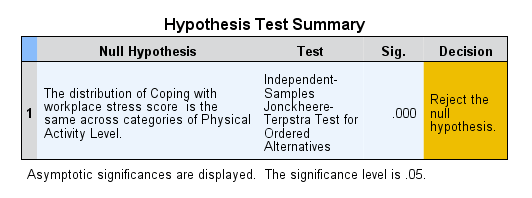
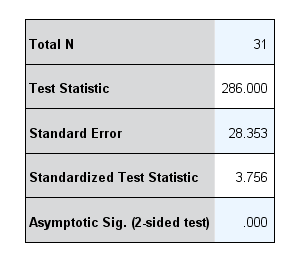
A researcher believes that individuals who are more physically active are better able to cope with stress in the workplace. To test this theory, the researcher recruited 31 participants and measured how many minutes of physical activity they performed per week and their ability to cope with workplace-related stress.
The participants were categorized into four groups based on the number of minutes of physical activity they performed each week; namely, "Sedentary", "Low", "Moderate" and "High" physical activity groups. These physical activity groups formed the groups of an ordinal independent variable called group. The ability to cope with workplace stress was assessed as the average score of a series of Likert items on a questionnaire, which allowed an overall 'coping with workplace stress' score to be calculated; higher scores indicating a greater ability to cope with workplace-related stress. This dependent variable was called coping_stress (N.B., the 'ability to cope with workplace-related stress' has been abbreviated as the 'CWWS' score for ease).
The researcher would like to know if the CWWS score increases with increasing physical activity level (i.e., increases from "Sedentary" to "High" physical activity level groups). In variable terms, does coping_stress increase with increasing levels of group?