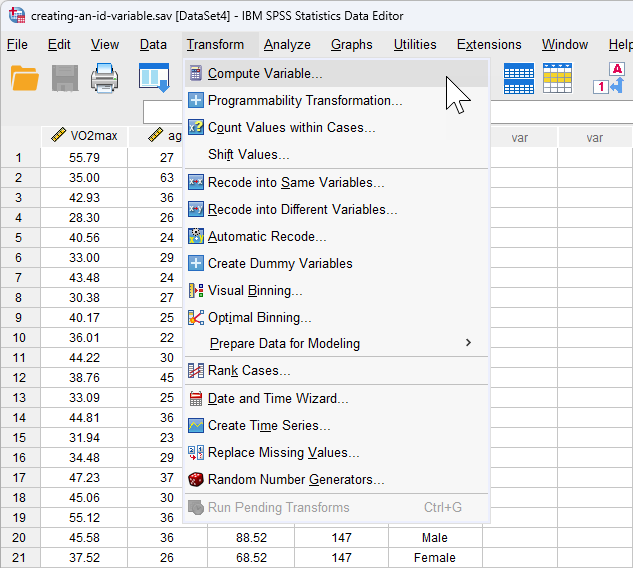
Creating an "ID" variable in SPSS Statistics
Introduction
An ID variable, also know as a case identifier or subject/participant ID, is often used in SPSS Statistics to distinguish between "cases" in your data set. Cases may be people (e.g., participants in your study), objects, animals or something else that you have measured.
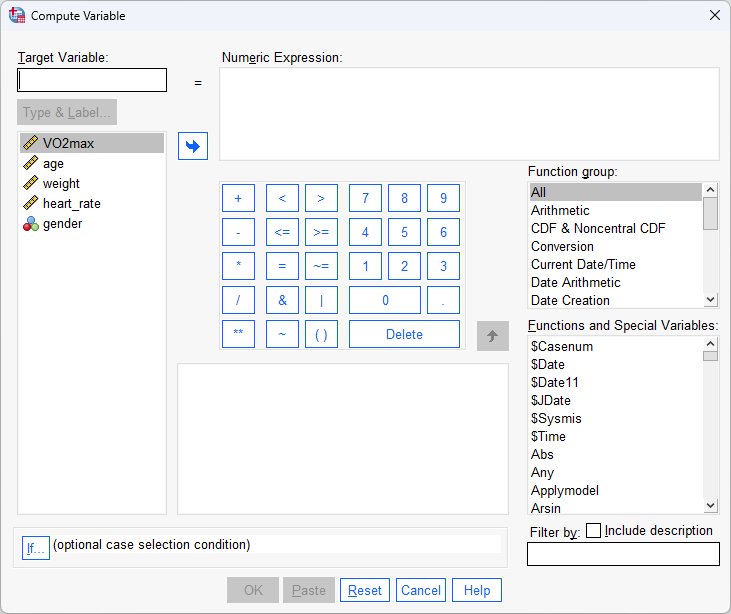
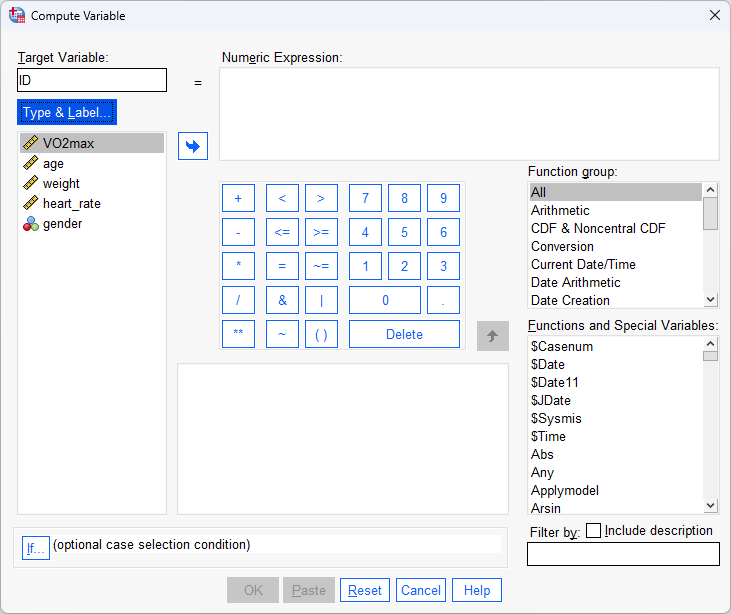
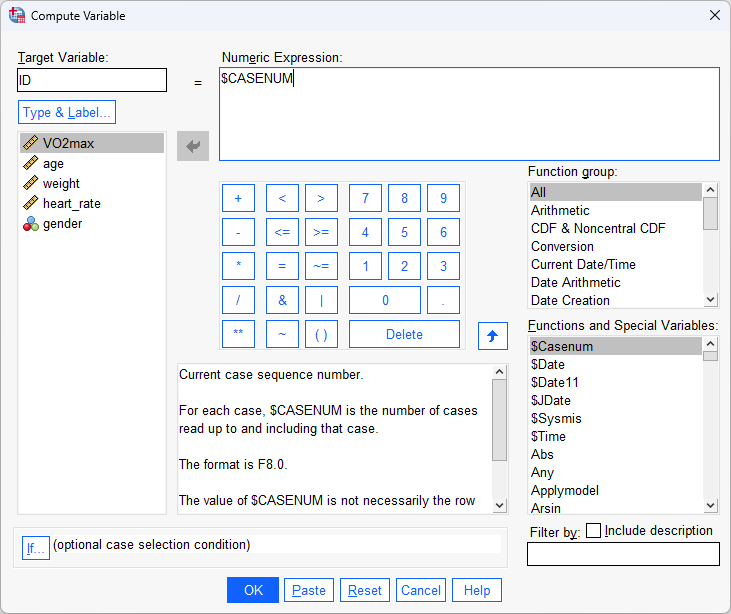
In this guide, we show you how to create an ID variable using the Compute Variable... procedure in SPSS Statistics. First, we set out the example used in this guide.
Note: The data setup and procedure to create an ID variable are identical for all versions of SPSS Statistics. However, in version 27, SPSS Statistics introduced a new look to their interface called "SPSS Light", replacing the previous look for versions 26 and earlier versions of SPSS Statistics, which was called "SPSS Standard". Therefore, if you are using SPSS Statistics version 26 or an earlier version of SPSS Statistics, the images in this guide will be blue rather than light grey. However, the data setup and procedure are identical.
SPSS Statistics
Data setup in SPSS Statistics
We want to carry out a multiple regression to predict maximal aerobic capacity (VO2max), which is an indicator of fitness and health, based on a person's age, weight, heart rate and gender. In this study, the dependent variable is "VO2max" and the four independent variables are "age", "weight", "heart rate" and "gender". Data was collected from 100 participants that took part in the research.
Explanation: An ID variable is not used directly in calculations for a multiple regression analysis. However, when testing the assumptions of a multiple regression, such as detecting outliers in the data, it becomes easier to identify such outliers when an ID variable has been created.
To set up these variables, SPSS Statistics has a Variable View where you define the types of variables you are analysing and a Data View where you enter your data for these variables. The data setup in the Variable View is shown below:
Published with written permission from SPSS Statistics, IBM Corporation.
Each of our five variables is displayed on a separate row (i.e., the dependent variable, VO2max, on row ![]() , and the four independent variables – age, weight, heart_rate and gender – on rows
, and the four independent variables – age, weight, heart_rate and gender – on rows ![]() ,
, ![]() ,
, ![]() and
and ![]() , respectively).
, respectively).
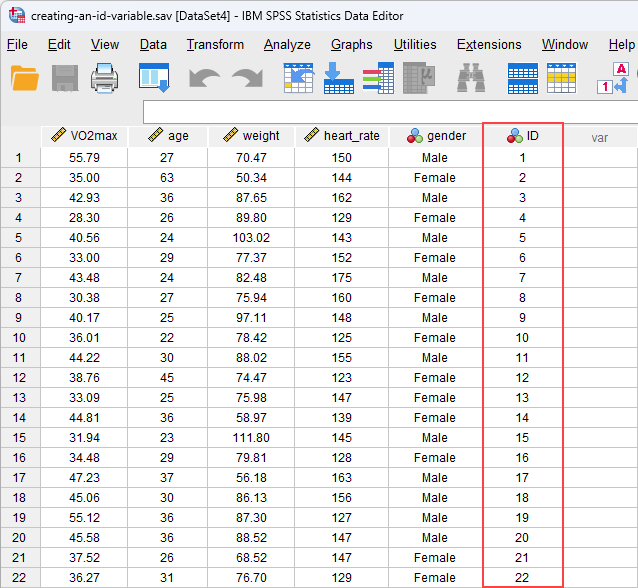
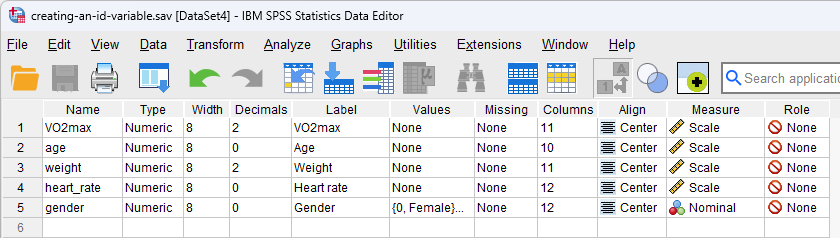
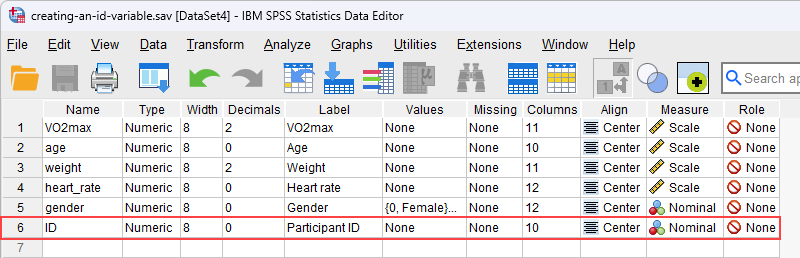
After you use the Compute Variable... procedure in SPSS Statistics later in this guide to create an ID variable, ID, this sixth variable will appear in our Variable View, as highlighted below:
Published with written permission from SPSS Statistics, IBM Corporation.
On row ![]() , you can see that the ID variable, ID, is a nominal variable (i.e.,
, you can see that the ID variable, ID, is a nominal variable (i.e., ![]() in the cell under the
in the cell under the ![]() column) with no decimal places (i.e., "0" in the cell under the
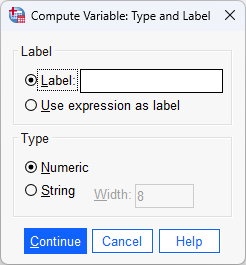
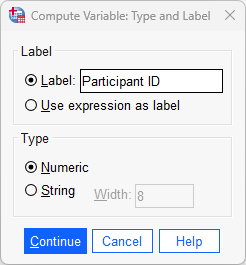
column) with no decimal places (i.e., "0" in the cell under the ![]() ). We have also given it the label, "Participant ID" (i.e., in the cell under the
). We have also given it the label, "Participant ID" (i.e., in the cell under the ![]() ) so that it is clear what the ID variable represents (i.e., the ID variable has been set up in our example to represent each of the 100 participants who took part in the research, but if your ID variable represents something different – perhaps an object, animal, a series of variables, etc. – you may want to label your ID variable accordingly). Finally, the cell under the
) so that it is clear what the ID variable represents (i.e., the ID variable has been set up in our example to represent each of the 100 participants who took part in the research, but if your ID variable represents something different – perhaps an object, animal, a series of variables, etc. – you may want to label your ID variable accordingly). Finally, the cell under the ![]() is set to
is set to ![]() .
.
Note: We suggest changing the cell under the
![]() column from
column from ![]() to
to ![]() , but you do not have to make this change. We suggest that you do because there are certain analyses in SPSS Statistics where the
, but you do not have to make this change. We suggest that you do because there are certain analyses in SPSS Statistics where the ![]() setting results in your variables being automatically transferred into certain fields in the dialogue boxes you may use to carry out your analysis. Since you may not want to transfer these variable, we suggest changing the
setting results in your variables being automatically transferred into certain fields in the dialogue boxes you may use to carry out your analysis. Since you may not want to transfer these variable, we suggest changing the ![]() setting to
setting to ![]() so that this does not happen automatically.
so that this does not happen automatically.
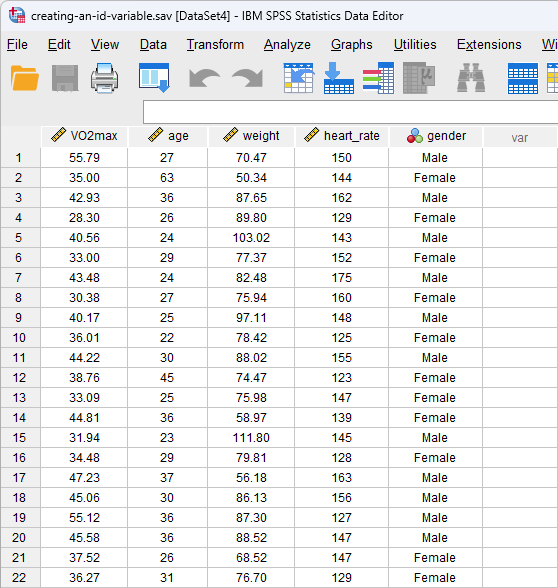
Based on the file setup for the five variables in the Variable View above (i.e., without the ID variable), the Data View window will look as follows:
Published with written permission from SPSS Statistics, IBM Corporation.
Our five variables are displayed in the columns of the Data View based on the order we entered them into the Variable View window. Therefore, in our example, we first entered the dependent variable, VO2max, so this appears in the first column, entitled ![]() , followed by the four independent variables from left to right: age in the second column, entitled
, followed by the four independent variables from left to right: age in the second column, entitled ![]() , and then weight, heart_rate and gender in the
, and then weight, heart_rate and gender in the ![]() ,
, ![]() and
and ![]() columns respectively.
columns respectively.
Note: The setup above is known as wide format because there is one case per row. This means that each row contains the data for a single case; that is, each row contains the scores for a single participant for each of the variables that have been measured. If your data is set up differently (i.e., in long format), the SPSS Statistics procedure shown in this guide will not help you to create an ID variable. If this is the case, please contact us.