Spearman's correlation using Minitab
Introduction
The Spearman rank-order correlation coefficient (shortened to Spearman’s correlation in Minitab) is a test which measures the strength and direction of association between two variables that are measured on an ordinal or continuous scale. It is often considered the nonparametric alternative to Pearson's correlation and can be run when there are violations of normality, a non-linear relationship or ordinal variables (such that Pearson's correlation cannot be used). Spearman's correlation coefficient is often denoted by the symbol rs (or the Greek letter ρ, pronounced rho).
For example, you could use a Spearman's correlation to understand whether there is an association between running performance and time spent training (i.e., your two variables would be "running performance", measured in time taken to run 10 km, and "time spent training", measured in hours per week). If there was a moderate, negative association, we could say that more time spent training was associated with better running performance (because the 10 km was covered more quickly). Alternately, you could use a Spearman's correlation to understand whether there is an association between length of unemployment and depression (i.e., your two variables would be "length of unemployment", measured in days, and "depression", measured using a continuous scale). If there was a strong, positive association, we could say that the longer the length of unemployment, the greater the level of depression.
In this guide, we show you how to carry out a Spearman's correlation using Minitab, as well as interpret and report the results from this test. However, before we introduce you to this procedure, you need to understand the different assumptions that your data must meet in order for a Spearman's correlation to give you a valid result. We discuss these assumptions next.
Minitab
Assumptions
Spearman's correlation has two assumptions. You cannot test the first of these assumptions with Minitab because it relates to your study design and choice of variables. However, you should check whether your study meets this assumption before moving on. If this assumption is not met, there is likely to be a different statistical test that you can use instead. Assumption #1 is explained below:
- Assumption #1: Your two variables should be measured at a continuous level (i.e., they are interval or ratio variables) or at an ordinal level. Examples of continuous variables include height (measured in feet and inches), temperature (measured in °C), salary (measured in US dollars), revision time (measured in hours), intelligence (measured using IQ score), firm size (measured in terms of the number of employees), age (measured in years), reaction time (measured in milliseconds), grip strength (measured in kg), power output (measured in watts), test performance (measured from 0 to 100), sales (measured in number of transactions per month), academic achievement (measured in terms of GMAT score), and so forth. Examples of ordinal variables include Likert items (e.g., a 7-point scale from "strongly agree" through to "strongly disagree"), amongst other ways of ranking categories (e.g., a 5-point scale explaining how much a customer liked a product, ranging from "Not very much" to "Yes, a lot"). If you are unsure whether your dependent variable is continuous (i.e., measured at the interval or ratio level) or ordinal, see our Types of Variable guide.
Assumptions #2 relates to the nature of your data and can be checked using Minitab. You have to check that your data meets this assumption because if it does not, the results you get when running a Spearman's correlation will not be valid. In fact, do not be surprised if your data violates this assumption. This is possible with real world data. However, there are possible solutions to correct such violations (e.g., transforming your data) such that you can still use a Spearman's correlation. Assumption #2 is explained below:
- Assumption #2: There needs to be a monotonic relationship between the two variables. Whilst there are a number of ways to check whether a monotonic relationship exists between your two variables, we suggest creating a scatterplot using Minitab, where you can plot the two variables against each other. You can then visually inspect the scatterplot to check for monotonicity. If the relationship displayed in your scatterplot is not monotonic, you will have to either run a different test or "transform" your data, which you can do using Minitab.
In practice, checking for assumption #2 will only take up a little more of your time when carrying out Spearman's correlation. Moreover, it is not a difficult task, and Minitab provides all the tools you need to do this.
In the section, Test Procedure in Minitab, we illustrate the Minitab procedure required to perform a Spearman's correlation assuming that no assumptions have been violated. First, we set out the example we use to explain the Spearman correlation procedure in Minitab.
Minitab
Example
A sports science student wants to determine whether performance in a 10 km run is associated with maximal aerobic capacity (i.e., how "fit" you are). Maximal aerobic capacity is usually measured in a laboratory using sophisticated equipment. The measure used to assess maximal aerobic capacity is VO2max. This is the maximum amount of oxygen your body can breathe in and use to power your muscles. As an analogy, you can think of it as a measure of how large a person's "engine" is. The bigger your engine, the faster you can go.
Therefore, to understand how 10 km run performance is associated to maximal aerobic capacity, the sports science student measured VO2max in 11 participants that were taking part in a local competitive 10 km run. The student also recorded the time in minutes the participants' took to complete the 10 km run. The participants were of a wide range of abilities. Expressed in variable terms, the student wants to show that there is an association between VO2max and Run Time.
Note: It is assumed that the data violated one or more of the assumptions of Pearson's correlation and, as such, a Spearman's rank correlation was conducted. Also, the example and data used for this guide are fictitious. We have just created them for the purposes of this guide.
Minitab
Setup in Minitab
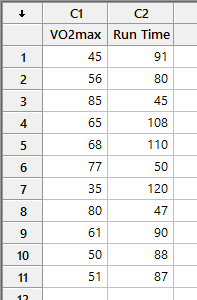
In Minitab, we entered our two variables into the first two columns (![]() and
and ![]() ). Under column
). Under column ![]() we entered the name of the variable, VO2max, as follows:
we entered the name of the variable, VO2max, as follows: ![]() . Then, under column
. Then, under column ![]() we entered the name of the second variable, Run Time, as follows:
we entered the name of the second variable, Run Time, as follows: ![]() . Finally, we entered the scores for the variable, VO2max, into the
. Finally, we entered the scores for the variable, VO2max, into the ![]() column, and the variable, Run Time, into the
column, and the variable, Run Time, into the ![]() column. This is illustrated below:
column. This is illustrated below:

Published with written permission from Minitab Inc.
Note: It does not matter which variable you enter under ![]() or
or ![]() . We have just entered the data into Minitab this way in our example.
. We have just entered the data into Minitab this way in our example.
Minitab
Test Procedure in Minitab
In this section, we show you how to analyse your data using Spearman's correlation in Minitab when the two assumptions set out in the Assumptions section have not been violated. Therefore, the four steps required to run a Spearman's correlation in Minitab are shown below:
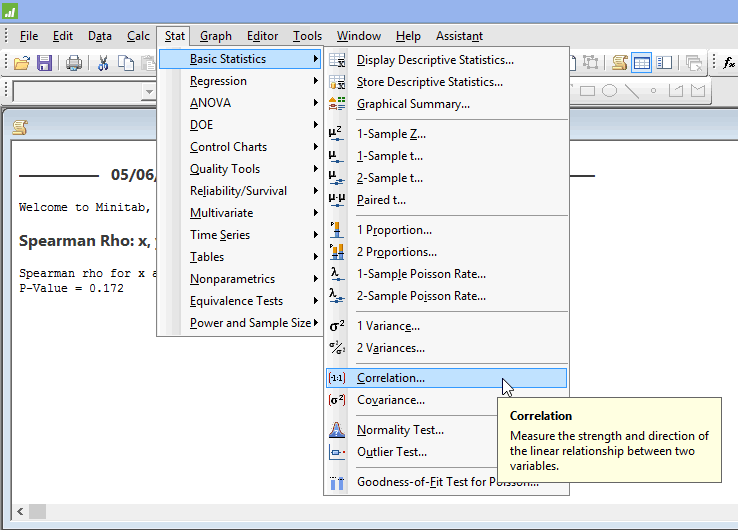
- Click Stat > Basic Statistics > Correlation... on the top menu, as shown below:

Published with written permission from Minitab Inc.
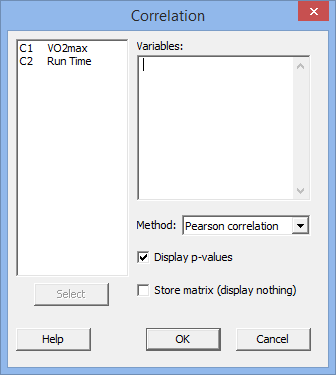
You will be presented with the following Correlation dialogue box:

Published with written permission from Minitab Inc.
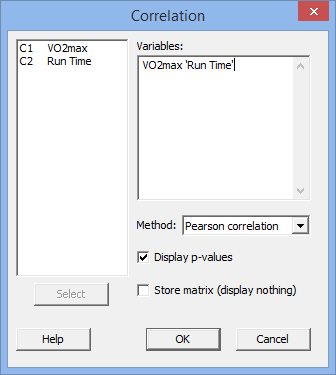
- Transfer both the variables, C1 VO2max and C2 Run Time, into the Variables: box. You will end up with the dialogue box shown below:

Published with written permission from Minitab Inc.
Note: To transfer the two variables, you first need to click inside the Variables: box for your two variables to appear in the main left-hand box (e.g., C1 VO2max and C2 Run Time). This will activate the
 button (it is usually faded:
  ). Since the Variables: box is where you put both your variables, you need to click on one of the variables in the main left-hand box and either press the
  button or simply double-click on the variable (e.g., C1 VO2max). You then need to repeat this procedure for the other variable you have not transferred (e.g., C2 Run Time). It does not matter in which order you transfer the variables.
- Select "Spearman rho" in the Method: drop-down box (i.e.,
 ). You will end up with the dialogue box shown below:

Published with written permission from Minitab Inc.
- Click on the
 button. The output that Minitab produces is shown below.
Minitab
Interpreting Spearman's correlation in Minitab
The Minitab output for a Spearman's correlation is shown below:

The output provides two important pieces of information:
- A. Spearman's correlation coefficient, ρ (i.e., rho). This assesses the strength of the association between these two variables (i.e., VO2max and Run Time).
- B. The two-tailed statistical significance of Spearman's correlation coefficient (i.e., the p-value).
In this example, Spearman's correlation coefficient is -0.618 (i.e., the "Spearman rho for VO2max and Run Time = -0.618" line), which indicates a moderate negative association between the two variables, VO2max and Run Time. This shows that higher values of VO2max are associated with faster (i.e., lower) running times. This makes sense because the 10 km run is a highly aerobic event and so it would seem plausible that individuals with higher aerobic capacities (i.e., a higher VO2max) can run faster and therefore have lower 10 km completion times (i.e., lower run times). You can also see that Spearman's correlation is statistically significant as p = .043 (i.e., the "P-Value = 0.043" line), which satisfies the common cut-off for statistical significance of p < .05.
Note: In addition to the Spearman's correlation output above, you will also have to interpret the scatterplots you used to check if there was a monotonic relationship between your two variables (i.e., Assumption #2) (see the Assumptions section earlier if you are unsure what this assumptions is). Remember that if your data failed any of these assumptions, the output that you get from the Spearman's correlation procedure (i.e., the output we discussed above) might not be valid and you will have to take steps to deal with such violations (e.g., transforming your data using Minitab) or use a different statistical test.
Minitab
Reporting the output of Spearman's correlation
When you report the output of your Spearman's correlation, it is good practice to include:
- A. An introduction to the analysis you carried out.
- B. Information about your sample, including any missing values.
- C. The value of Spearman's correlation coefficient, ρ (or rs).
- D. A statement of whether the association was statistically significant (i.e., the two-tailed p-value).
Based on the Minitab output above, we could report the results of this study as follows:
- General
A Spearman's correlation was run to assess the association between 10 km run time and VO2max using a small sample of 11 participants. There was a moderate negative association between run time and VO2max, which was statistically significant, rs = -0.618, p = .043.
In addition to reporting the results as above, a diagram can be used to visually present your results. For example, you could use a scatterplot to make it easier for others to understand your results.


