Testing for Normality using SPSS Statistics
Introduction
An assessment of the normality of data is a prerequisite for many statistical tests because normal data is an underlying assumption in parametric testing. There are two main methods of assessing normality: graphically and numerically.
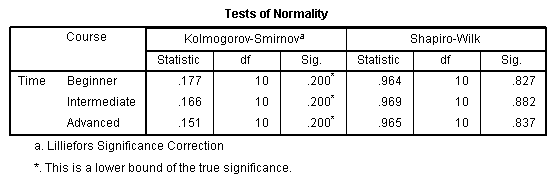
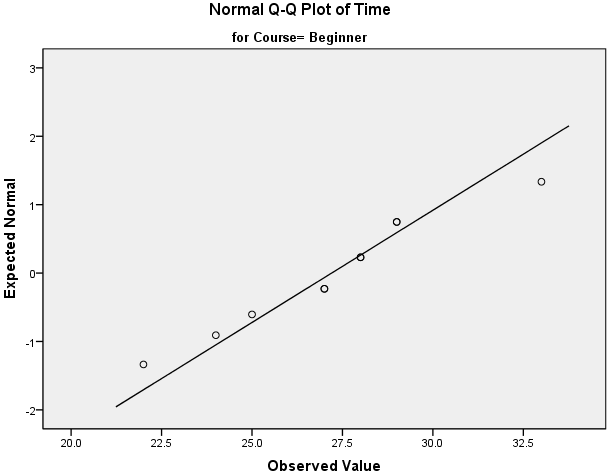
This "quick start" guide will help you to determine whether your data is normal, and therefore, that this assumption is met in your data for statistical tests. The approaches can be divided into two main themes: relying on statistical tests or visual inspection. Statistical tests have the advantage of making an objective judgement of normality, but are disadvantaged by sometimes not being sensitive enough at low sample sizes or overly sensitive to large sample sizes. As such, some statisticians prefer to use their experience to make a subjective judgement about the data from plots/graphs. Graphical interpretation has the advantage of allowing good judgement to assess normality in situations when numerical tests might be over or under sensitive, but graphical methods do lack objectivity. If you do not have a great deal of experience interpreting normality graphically, it is probably best to rely on the numerical methods.
If you want to be guided through the testing for normality procedure in SPSS Statistics for the specific statistical test you are using to analyse your data, we provide comprehensive guides in our enhanced content. For each statistical test where you need to test for normality, we show you, step-by-step, the procedure in SPSS Statistics, as well as how to deal with situations where your data fails the assumption of normality (e.g., where you can try to "transform" your data to make it "normal"; something we also show you how to do using SPSS Statistics). You can learn about our enhanced content in general on our Features: Overview page or how we help with assumptions on our Features: Assumptions page. However, in this "quick start" guide, we take you through the basics of testing for normality in SPSS Statistics.
SPSS Statistics
Methods of assessing normality
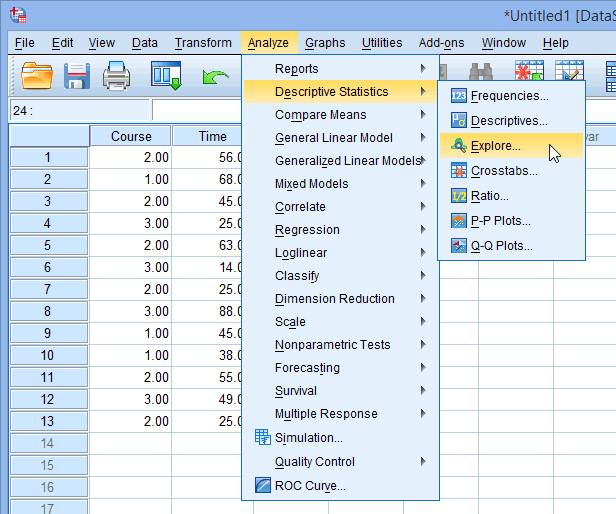
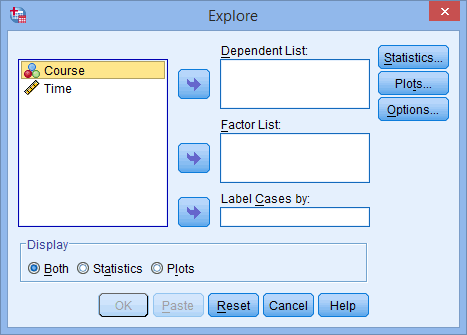
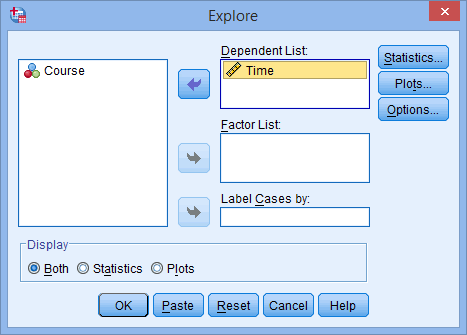
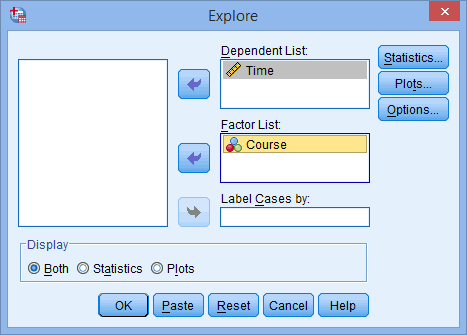
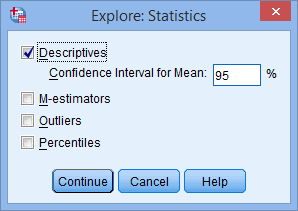
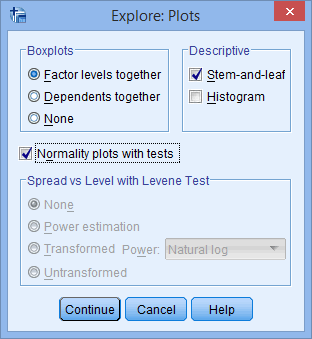
SPSS Statistics allows you to test all of these procedures within Explore... command. The Explore... command can be used in isolation if you are testing normality in one group or splitting your dataset into one or more groups. For example, if you have a group of participants and you need to know if their height is normally distributed, everything can be done within the Explore... command. If you split your group into males and females (i.e., you have a categorical independent variable), you can test for normality of height within both the male group and the female group using just the Explore... command. This applies even if you have more than two groups. However, if you have 2 or more categorical, independent variables, the Explore... command on its own is not enough and you will have to use the Split File... command also.
Note: The procedures that follow are identical for SPSS Statistics versions 17 to 30, as well as the subscription version of SPSS Statistics, with version 30 and the subscription version being the latest versions of SPSS Statistics. However, in version 27 and the subscription version, SPSS Statistics introduced a new look to their interface called "SPSS Light", replacing the previous look for versions 26 and earlier versions, which was called "SPSS Standard". Therefore, if you have SPSS Statistics versions 27 to 30 (or the subscription version of SPSS Statistics), the images that follow will be light grey rather than blue. However, the procedures are identical.