Login

Testing for Normality using SPSS Statistics (cont...)

Procedure when there are two or more independent variables

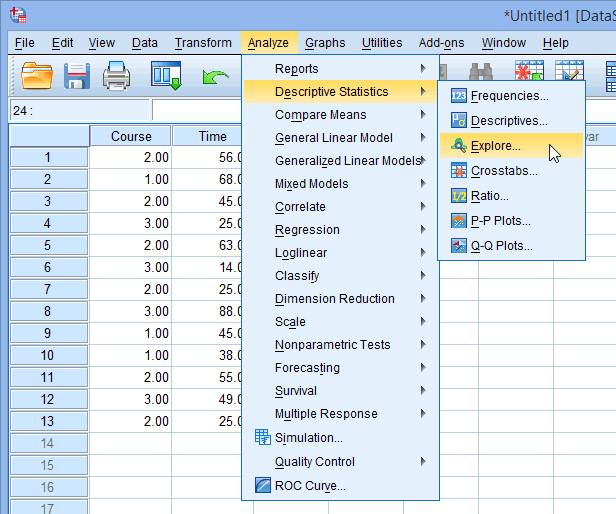
The Explore... command on its own cannot separate the dependent variable into groups based on not one but two or more independent variables. However, we can perform this feat by using the Split File... command.

  1. Click Data > Split File... on the top menu as shown below:
    Normality Screenshot

    Published with written permission from SPSS Statistics, IBM Corporation.

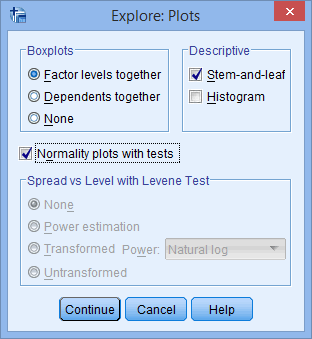
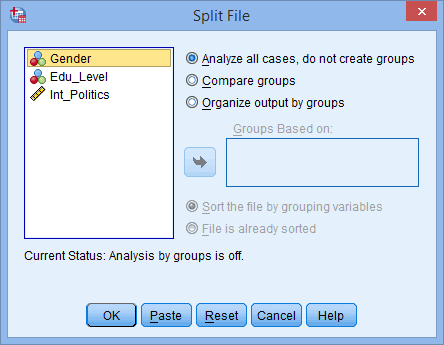
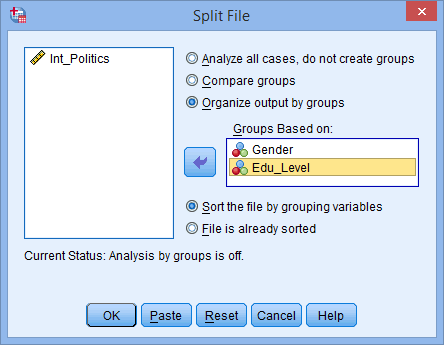
  2. You will be presented with the Split File dialogue box, as shown below:
    Normality Screenshot

    Published with written permission from SPSS Statistics, IBM Corporation.

  3. Click the radio option, Organize output by groups. Transfer the independent variables you wish to categorize the dependent variable on into the Groups Based on: box. In this example, we want to know whether interest in politics (Int_Politics) is normally distributed when grouped/categorized by Gender AND Edu_Level (education level). You will be presented with the following screen:
    Normality Screenshot

    Published with written permission from SPSS Statistics, IBM Corporation.

  4. Click on the SPSS OK Button button.

Note: Your file is now split and the output from any tests will be organized into the groups you have selected.

Join the 10,000s of students, academics and professionals who rely on Laerd Statistics.TAKE THE TOUR
  1. Click Analyze > Descriptive Statistics > Explore... on the top menu as shown below:
    Normality Screenshot

    Published with written permission from SPSS Statistics, IBM Corporation.

  2. You will be presented with the Explore dialogue box, as shown below:
    Normality Screenshot

    Published with written permission from SPSS Statistics, IBM Corporation.

  3. Leave the above options unchanged and click on the SPSS Continue Button button.
  4. Transfer the variable that needs to be tested for normality into the Dependent List: box by either drag-and-dropping or using the SPSS Right Arrow Button button. In this example, we transfer the Int_Politics variable into the Dependent List: box. You will then be presented with the following screen:
    Normality Screenshot

    Published with written permission from SPSS Statistics, IBM Corporation.

    Note: There is no need to transfer the independent variables Gender and Edu_Level into the Factor List: box because this has been accomplished with the Split File... command. We cannot simply transfer these two independent variables into the Factor List: box because this will not achieve the desired result. It will first analyse Int_Politics for normality with respect to Gender and then with respect to Edu_Level. It does NOT analyse Int_Politics for normality by grouping individuals into both Gender and Edu_Level AT THE SAME TIME.

  5. Click on the SPSS Statistics Button button. You will be presented with the Explore: Statistics dialogue box, as shown below:
    Normality Screenshot

    Published with written permission from SPSS Statistics, IBM Corporation.

  6. Leave the above options unchanged and click on the SPSS Continue Button button.
  7. Click on the SPSS Plots Button button. Change the options so that you are presented with the following screen:
    Normality Screenshot

    Published with written permission from SPSS Statistics, IBM Corporation.

  8. Click on the Continue button.
  9. Click on the OK button.
Testimonials
TAKE THE TOUR


SPSS Statistics

Output

You will now see that the output has been split into separate sections based on the combination of groups of the two independent variables. As an example we show the tests of normality when the dependent variable, "Int_Politics", is categorized into the first "Gender" group (male) and first "Edu_Level" group (School). All other possible combinations are also presented in the full output but we will not shown them here for clarity.

Normality Screenshot

Published with written permission from SPSS Statistics, IBM Corporation.

Under this above category you are presented with the Tests of Normality table as shown below:

Normality Screenshot

Published with written permission from SPSS Statistics, IBM Corporation.

The Shapiro-Wilk test is now analysing the normality of "Int_Politics" on the data of those individuals that are classified as both "male" in the independent variable, "Gender", and "school" in the independent variable "Edu_Level". As the Sig. value under the Shapiro-Wilk column is greater than 0.05, we can conclude that "Int_Politics" for this particular subset of individuals is normally distributed.

The same data from the same individuals are now also being analysed to produce a Normal Q-Q Plot as below. From this graph, we can conclude that the data appears to be normally distributed as it follows the diagonal line closely and does not appear to have a non-linear pattern.

Normality Screenshot

Published with written permission from SPSS Statistics, IBM Corporation.

Join the 10,000s of students, academics and professionals who rely on Laerd Statistics.TAKE THE TOUR
« prev