How to do Normal Distributions Calculations
This guide will show you how to calculate the probability (area under the curve) of a standard normal distribution. It will first show you how to interpret a Standard Normal Distribution Table. It will then show you how to calculate the:
We have a calculator that calculates probabilities based on z-values for all the above situations. In addition, it also outputs all the working to get to the answer, so you know the logic of how to calculate the answer.
How to Use the Standard Normal Distribution Table
The most common form of standard normal distribution table that you see is a table similar to the one below (click image to enlarge):
The Standard Normal Distribution Table
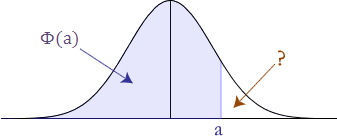
The standard normal distribution table provides the probability that a normally distributed random variable Z, with mean equal to 0 and variance equal to 1, is less than or equal to z. It does this for positive values of z only (i.e., z-values on the right-hand side of the mean). What this means in practice is that if someone asks you to find the probability of a value being less than a specific, positive z-value, you can simply look that value up in the table. We call this area Φ. Thus, for this table, P(Z < a) = Φ(a), where a is positive.
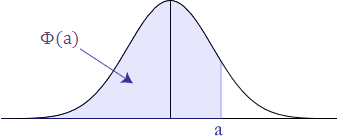
Diagrammatically, the probability of Z less than 'a' being Φ(a), as determined from the standard normal distribution table, is shown below:
Probability less than a z-value
P(Z < –a)
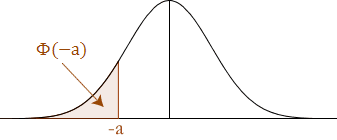
As explained above, the standard normal distribution table only provides the probability for values less than a positive z-value (i.e., z-values on the right-hand side of the mean). So how do we calculate the probability below a negative z-value (as illustrated below)?
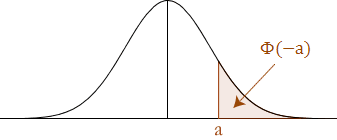
We start by remembering that the standard normal distribution has a total area (probability) equal to 1 and it is also symmetrical about the mean. Thus, we can do the following to calculate negative z-values: we need to appreciate that the area under the curve covered by P(Z > a) is the same as the probability less than –a {P(Z < –a)} as illustrated below:
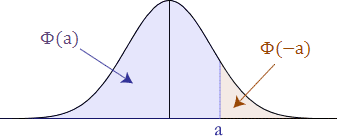
Making this connection is very important because from the standard normal distribution table, we can calculate the probability less than 'a', as 'a' is now a positive value. Imposing P(Z < a) on the above graph is illustrated below:
From the above illustration, and from our knowledge that the area under the standard normal distribution is equal to 1, we can conclude that the two areas add up to 1. We can, therefore, make the following statements:
Φ(a) + Φ(–a) = 1
∴ Φ(–a) = 1 – Φ(a)
Thus, we know that to find a value less than a negative z-value we use the following equation:
Φ(–a) = 1 – Φ(a), e.g. Φ(–1.43) = 1 – Φ(1.43)
Probability greater than a z-value
P(Z > a)
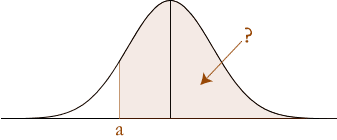
The probability of P(Z > a) is: 1 – Φ(a). To understand the reasoning behind this look at the illustration below:
You know Φ(a) and you know that the total area under the standard normal curve is 1 so by mathematical deduction: P(Z > a) is: 1 - Φ(a).
P(Z > –a)
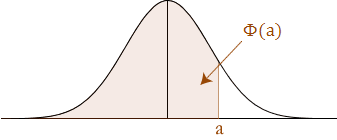
The probability of P(Z > –a) is P(a), which is Φ(a). To understand this we need to appreciate the symmetry of the standard normal distribution curve. We are trying to find out the area below:
But by reflecting the area around the centre line (mean) we get the following:
Notice that this is the same size area as the area we are looking for, only we already know this area, as we can get it straight from the standard normal distribution table: it is P(Z < a). Therefore, the P(Z > –a) is P(Z < a), which is Φ(a).
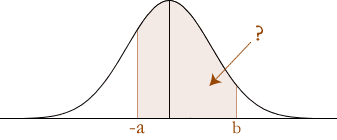
Probability between z-values
You are wanting to solve the following:
The key requirement to solve the probability between z-values is to understand that the probability between z-values is the difference between the probability of the greatest z-value and the lowest z-value:
P(a < Z < b) = P(Z < b) – P(Z < a)
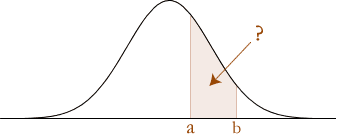
which is illustrated below:
P(a < Z < b)
The probability of P(a < Z < b) is calculated as follows.
First separate the terms as the difference between z-scores:
P(a < Z < b) = P(Z < b) – P( Z < a) (explained in the section above)
Then express these as their respective probabilities under the standard normal distribution curve:
P(Z < b) – P(Z < a) = Φ(b) – Φ(a).
Therefore, P(a < Z < b) = Φ(b) – Φ(a), where a and b are positive.
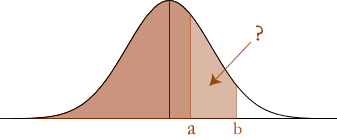
P(–a < Z < b)
The probability of P(–a < Z < b) is illustrated below:
First separate the terms as the difference between z-scores:
P(–a < Z < b) = P(Z < b) – P(Z < –a)
Then express these as their respective probabilities under the standard normal distribution curve:
P(Z < b) – P(Z < –a) = Φ(b) – Φ(–a)
= Φ(b) – {1 – Φ(a)}P(Z < –a) explained above.
∴ P(–a < Z < b) = Φ(b) – {1 – Φ(a)}, where a is negative and b is positive.
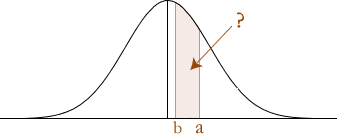
P(–a < Z < –b)
The probability of P(–a < Z < –b) is illustrated below:
First separate the terms as the difference between z-scores:
P(–a < Z < –b) = P(Z < –b) – P( Z < –a)
Then express these as their respective probabilities under the standard normal distribution curve:
P(Z < b) – P(Z < –a) = Φ(–b) – Φ(–a)
= {1 – Φ(b)} – {1 – Φ(a)} P(Z < –a) explained above.
= 1 – Φ(b) – 1 + Φ(a)
= Φ(a) – Φ(b)
The above calculations can also be seen clearly in the diagram below:
Notice that the reflection results in a and b "swapping positions".
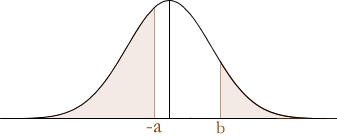
Probability outside of a range of z-values
An illustration of this type of problem is found below:
To solve these types of problems, you simply need to work out each separate area under the standard normal distribution curve and then add the probabilities together. This will give you the total probability.
When a is negative and b is positive (as above) the total probability is:
P(Z < –a) + P(Z > b) = Φ(–a) + {1 – Φ(b)} P(Z > b) explained above.
= {1 – Φ(a)} + {1 – Φ(b)} P(Z < –a) explained above.
= 1 – Φ(a) + 1 – Φ(b)
= 2 – Φ(a) – Φ(b)
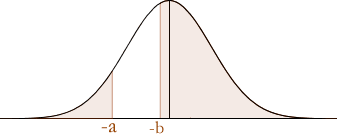
When a and b are negative as illustrated below:
The total probability is:
P(Z < –a) + P(Z > –b) = Φ(–a) + Φ(b)P(Z > –b) explained above.
= {1 – Φ(a)} + Φ(b)P(Z < –a) explained above.
= 1 + Φ(b) – Φ(a)
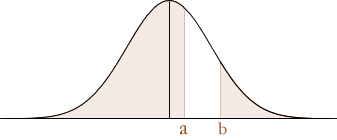
When a and b are positive as illustrated below:
The total probability is:
P(Z < a) + P(Z > b) = Φ(a) + {1 – Φ(b)}P(Z > b) explained above.
= 1 + Φ(a) – Φ(b)
Check out our calculator to get some practice in!